7P marketingu služeb – Význam, důležitost a příklady

Začněte konkrétní akcí: investujte do 90denního plánu, který spojuje sedm P s jedním jasným výsledkem pro zákazníka a měřte pokrok týdně. Tyto kroky udržují každý tým soustředěný a překonávají obecné cíle dodáním hmatatelných zlepšení v zážitku.
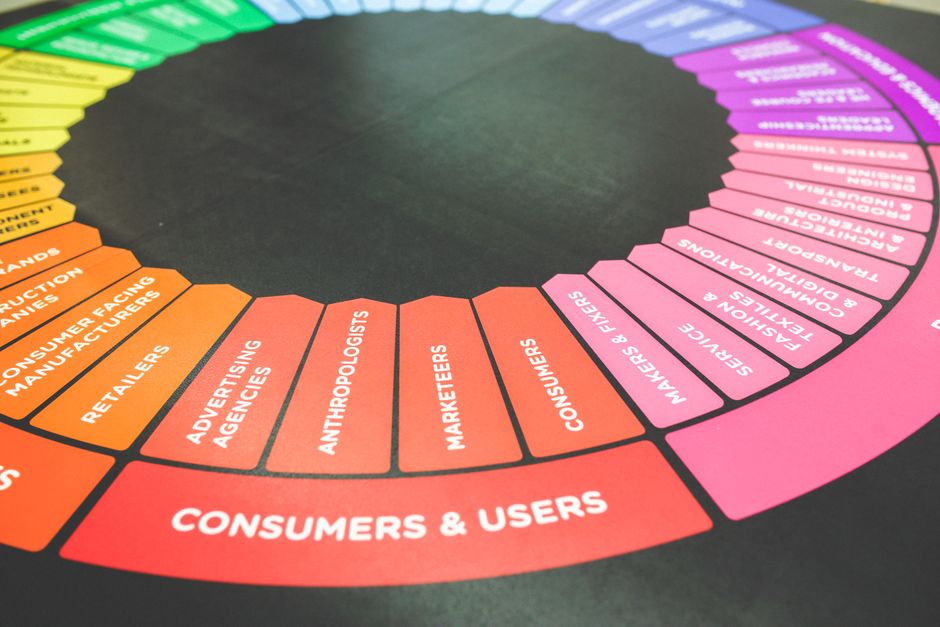
Model se skládá ze sedmi prvků: Product, Price, Place, Promotion, People, Process a Physical Evidence. V praxi Product pokrývá samotnou službu a doprovodné vybavení a materiálové signály, které formují myšlení a vnímání. Tyto prvky nabízejí rámec pro analýzu toho, co zákazníci zažívají a co zaměstnanci dodávají na každém kontaktním bodě.
Význam se objevuje, když sladíte každé P se očekáváními zákazníků. Pro analýzu zpětné vazby a sledování vnímání říkáte, kde se objevují mezery, a rychle upravujete. Lepší zážitek ze služby spoléhá na personalizované nabídky, jasný jazyk zaměstnanců a spolehlivé procesy, které překračují sliby. Podpořte zprávu propagačními materiály, které posilují hodnotu a důvěru.
Praktické kroky: investujte do školení zaměstnanců, přepracujte procesy a vytvořte personalizovanou nabídku, která se hodí k různým cestám. Zaměřte se na propagační kampaně, které jasně říkají hodnotu, a zajistěte, aby materiál použitý na každém kontaktním bodě podporoval zprávu. Tyto kroky zajistí, že zákazník vidí hodnotu během celé interakce a že slib značky přechází od povědomí k akci.
Reálné příklady zahrnují hotely, kliniky, e-commerce služby a parky. V hotelu upravte Place tak, aby zahrnoval intuitivní online rezervaci a plynulý tok na místě; propagujte propagačními nabídkami; školte People, aby předvídali potřeby hostů. Pro parky se zaměřte na Physical Evidence s čistými značkami a bezpečnými zařízeními pro zvýšení vnímání. Stejný přístup funguje pro kampusovou knihovnu, lékařskou praxi nebo regionální parkovou oblast: sladíte sedm P, měříte výsledky jako spokojenost, opakované návštěvy a doporučení, abyste určili hodnotu každého prvku.
Praktický průvodce aplikací 7P se zaměřením na Physical Evidence
Začněte audit fyzického důkazu, aby sladili všechny kontaktní body směřující k klientům kolem značky a nezapomenutelného zážitku. V tomto článku definujte stručný kontrolní seznam: prostředí obchodu nebo kanceláře, kvalita značek, balení produktu, vzhled zaměstnanců, konzistence digitálního a fyzického, a signály prostředí služeb. To buduje úspěšný, koherentní dojem napříč místy.
Jerome poznamenává, že fyzický důkaz kotví vnímání a odemyká potenciál pro unikátní, nezapomenutelnou značku. Význam konzistentních signálů se stává jasným, když pozorujete rozhodnutí v bodě kontaktu. Pečlivě spravujte prostředí, aby splnilo očekávání zákazníků na každém místě. Koordinovaný soubor taktik, od značek po texturu, vytváří myšlenkovou cestu, která vede kupující k sebevědomé volbě. Příklady ze Švédska ukazují, jak jednoduché, dobře provedené signály zvyšují vnímánou kvalitu bez těžké investice do nákladných aktiv.
Definujte metriky pro posouzení dopadu: čas strávený v prostoru, opakované návštěvy, sociální zmínky o značce a vzpomínka zákazníků na balení. Používejte kontrolované změny v jednom prostředí před širším rozsahem. To udržuje investici do fyzických aktiv soustředěnou a přináší rychlé důkazy o dopadu. To podporuje vidění jako partnera, ne jen prodavače. Používejte různé signály k signalizaci spolehlivosti. Nezapomenutelný zážitek vzniká, když spojíte signály – barvu, texturu, vůni, hudbu – s jasným účelem.
Implementujte fázi plánu: upgradujte jedno místo najednou, dokumentujte výsledky k splnění interních cílů. Vytvořte sadu balení a značek, kterou týmy mohou znovu použít, zajistěte konzistenci napříč lokalitami. Jedna dobře strukturovaná sada umožňuje značce ve Švédsku a dál zůstat koherentní a škálovatelnou.
Shrňte kontrolním seznamem: proveďte čtvrtletní revizi značek, kvality zařízení a balení a upravte taktiky podle potřeby. Soustředěné řízení prostředí a spolupráce napříč týmy zajistí, že všechny vizuály, zvuky a textury zůstanou sladěné se unikátní hodnotou a účelem značky. Výsledek je úspěšná, nezapomenutelná přítomnost, která podporuje růst a zlepšuje existenci značky. Tento přístup se zaměřuje na konzistenci napříč kanály.
Význam 7P: co každý P pokrývá a jak se kombinují
Nyní mapujte každý P na kontext vaší služby: seznamte, co každý P pokrývá a kde se s ním zákazníci setkávají, pak spojte tyto kontakty s oblastmi zařízení a časy. Tato sladěnost vám umožní rychle testovat změny a identifikovat mezery mezi tím, co nabízíte, a tím, co hosté očekávají.
Product pokrývá jádro služby a možné rozšíření, jako přidané zážitky, balíčky nebo loajální možnosti, zejména pro restaurace a kavárny.
Price signalizuje hodnotu a dostupnost; vyberte možnosti jako balíčky nebo vrstvené menu, které se hodí k různým rozpočtům.
Place popisuje, jak služba dosáhne hostů, včetně toho, kde je dodána, rozložení zařízení a době dodání.
Promotion nabízí praktické návrhy pro jasnou komunikaci a podporu prodeje, jako kurzy pro zaměstnance a ochutnávkové akce pro přilákání hostů restaurací a kaváren.
People pokrývá tým a zákazníky; mít správné lidi s určitými dovednostmi mění, jak služba působí.
Process mapuje kroky služby od rezervace po splnění, zajišťuje plynulou dodávku napříč oblastmi a různými časy.
Physical evidence kotví vnímání: prostředí zařízení, značky, design menu a další hmatatelné signály, které hosté objevují.
Ze všeho nejdůležitější je použít teorii k vedení rozhodnutí; matice ukazuje, jak se těchto sedm oblastí P překrývá v každé fázi a co je změněno nebo zlepšeno. Highlighty zahrnují konkrétní příklady a návrhy, jako kavárna přidávající rozšíření snídaně, restaurace nabízející kurzy pro zaměstnance a prodejní propagaci, která zvyšuje příjmy – objevte, kde se hodí další úpravy.
Spojení každého P s cestou zákazníka: mapování kontaktních bodů od prvního kontaktu po loajalitu
Začněte datově řízenou mapou, která spojuje každé P s fázemi cesty zákazníka, od prvního kontaktu po loajalitu. Řešte níže uvedených sedm P s explicitními kontaktními body pro každou fázi: první kontakt, průzkum, rozhodnutí, dodání, péče po službě a obhajoba. Používejte metriky k sledování vlivu na vnímání, důvěru a náklady a nastavte cíle pro vyšší loajalitu napříč kanály. Vycházejíc z fundamentalů včetně Bitnerova rámce a tématu založeného na službách, tento přístup udržuje operace soustředěné na to, co zákazníci potřebují a co dodává hodnotu. Zde je, jak to aplikovat v praxi.
Product: Sladěte atributy jádra služby s potřebami fáze cesty. V zdravotnictví to znamená jasné podněty k objednání, přesný příjem a spolehlivou dodávku péče. Pro každý kontaktní bod definujte očekávaný výsledek, jak nabídka založená na službách řeší potřebu a jak změříte dopad na vnímání a důvěru. To představuje hodnotu a zvyšuje pravděpodobnost loajality.
Price: Mapujte náklady na vnímánou hodnotu na každém kontaktním bodě. Nabízejte transparentní ceny, balíčkové možnosti a jasné vysvětlení toho, co je zahrnuto. Sledujte, jak signály nákladů ovlivňují rozhodnutí, a používejte zprávy založené na hodnotě k posílení důvěry a loajality. Cílem je udržet celkové náklady na získání a služby pod benchmarkem při zvyšování ochoty zákazníků platit za spolehlivou dodávku.
Place: Identifikujte, kde zákazníci interagují – online plánování, recepce, chodby kliniky nebo mobilní aplikace – a zajistěte, aby kontaktní body fáze cesty byly plynulé. Standardizujte zážitky kanálů, snižte předávání a měřte čekací doby a spokojenost s kanály. Kde je to možné, konsolidujte kanály k snížení nákladů a zvýšení důvěry, zejména v prostředích zdravotnictví.
Promotion: Vytvářejte zprávy, které ovlivňují potřeby a vnímání v každé fázi. Používejte příběhy pacientů, vzdělávací obsah a připomínky k podněcování k konkrétním akcím, s zaměřením na snížení tření a posílení loajality. Sledujte míru odezvy, konverzi a dlouhodobý dopad na důvěru a ochotu doporučit.
People: Školte frontové týmy, aby odrážely hodnoty založené na službách a zvládaly obavy s empatií. V zdravotnictví to zvyšuje důvěru pacientů během registrace, konzultací a propuštění. Jasná odpovědnost a zpětné vazby zvyšují kvalitu operací, snižují zbytečné přepracování a posouvají loajalitu výše konzistentním splňováním potřeb a očekávání.
Process: Dokumentujte kroky dodávky služby a přiřaďte vlastníky, s SLA na každém kontaktním bodě. Zjednodušte předávání, automatizujte, kde je to vhodné, a monitorujte doby cyklů a míru chyb. Čistý proces snižuje náklady na dodávku při zvyšování vnímáné spolehlivosti a důvěry, což zase zvyšuje loajalitu.
Physical Evidence: Sladěte značky, zařízení, značení a digitální rozhraní se slíbenou službou. V zdravotnictví čisté vyšetřovací místnosti, čitelné formuláře a jasné informace u lůžka posilují vnímání a důvěru. Používejte důkazy jako svědectví, certifikáty a viditelné standardy k signalizaci kvality a posílení loajality.
Snapshots průmyslu: reálné příklady z pohostinství, cestování a zdravotnictví
Začněte šestitýdenní sérii k testování směsi 7P napříč pohostinstvím, cestováním a zdravotnictvím, pomocí jednoho pilotního hotelu v Mexiku, jedné trasy v cestování a jedné kliniky k shromáždění konkrétních dat.
-
Snapshot pohostinství
Skupina středně velkých hotelů v Mexiku přepracovává kontaktní body hostů kolem tematického zážitku. Ingredience zahrnují uvolňující atmosféru lobby, podpisovou tematickou místnost, on-site obchod s místními zbožími a noční zábavu. Používají kanály jako mobilní aplikaci, tablet v pokoji a concierge na recepci k dodávce nabídek a aktualizací. Smyčka zpětné vazby po prodeji s krátkým průzkumem po pobytu pomáhá zdokonalovat službu a hodnocení stoupne z 4,2 na 4,6 za 12 týdnů. Přístup podporuje jak vysokou spokojenost hostů, tak inkrementální příjmy z obchodu a jídelny zjednodušením rozhodnutí o koupi s flexibilním kreditem u pokladny. Pro menší společnosti se tento model škáluje s těsným rozpočtem a jasným vlastnictvím napříč operacemi, marketingem a týmy služeb.
- Posun celkového hodnocení: 4,2 → 4,6
- Příjmy z obchodu a jídelny: +6 %
- Snížení času check-in: ≈20 sekund
-
Snapshot cestování
Regionální letecká společnost spolupracuje s turistickými radami k vytvoření balíčkových nabídek, umožňujících zákazníkům koupit lety, hotely a zážitky v jednom kanálu. Multi-kanálový obchod zahrnuje web, mobilní aplikaci, call centrum a partnerské cestovní obchody. Používají metodu, která zdůrazňuje jasné ceny, zásady zavazadel a proaktivní aktualizace prostřednictvím SMS a dedikovaného chat kanálu. Podpora po prodeji uzavírá smyčku, pomáhá zvyšovat hodnocení a podporovat opakované rezervace. Navíc iniciativa využívá spolupráce s marketboats s výletními loděmi a zábavními místy k rozšíření přitažlivosti při poznamenání omezení jako regulační omezení a ochrana dat.
- Rezervace balíčků vzrostly o dvouciferné číslo
- Cílený nárůst NPS: +8 bodů za šest měsíců
- Možnosti plateb s flexibilitou kreditu zlepšily konverzi
-
Snapshot zdravotnictví
Síť nemocnic implementuje metodu řízenou procesem k zlepšení toku pacientů: instrukce před návštěvou, zjednodušená registrace a uklidňující čekárna se zábavou. Téma se soustředí na léčení, s vícejazyčnými značkami a portálem pro pacienty pro následování po prodeji. Jednoduchá možnost fakturace snižuje tření v době koupě služeb. Zpětná vazba pacientů se převádí do změn ve školení zaměstnanců a rozložení místností. Rané výsledky ukazují pokles čekacích dob a vzestup celkového hodnocení spokojenosti, zatímco pacienti chválí responzivitu frontových týmů.
- Snížení čekací doby: ~12 minut na návštěvu
- Celková spokojenost pacientů: 4,3 → 4,7
- Snížení tření fakturace prostřednictvím vylepšených kreditních možností
Navíc tyto příklady zdůrazňují praktické výhody sladění tématu, zábavy a funkcí obchodu s jasnou strategií kanálu. Udržujte se soustředění na křížové vlastnictví funkcí a měřitelné výsledky, používejte data k rozšíření úspěšných praktik na jiné trhy při řešení regulačních a soukromí omezení. Přístup se odvolává na reálné chování koupě, podporu po prodeji a celkový zážitek spíše než izolované úpravy.
Design fyzického důkazu: signály, prostředí a hmatatelné nástroje služeb, které formují vnímání

Rychle sladěte signály, prostředí a hmatatelné nástroje se slibem vaší značky, formujte vnímání zákazníků při prvním kontaktu. Na základě zpětné vazby od zákazníků používejte jasné zprávy před zahájením služby k nastavení očekávání a snížení nejistoty.
Když jde o dodávku služby, signály mají význam. První dojem pochází z toho, co zákazníci vidí, slyší a cítí v okamžiku kontaktu, takže rozhodnutí o designu by měla být záměrná a testovatelná.
Klíčové kroky vyžadují křížovou sladěnost funkcí.
- Signály: Vyberte koherentní paletu barev, konzistentní typografii a kvalitní materiály pro značky, menu a balení. Signály komunikují vaši úroveň péče a nastavují tón pro interakce; každý povrch představuje vaši značku a měl by posilovat důvěryhodnost. Cílem je rychlá, čitelná zpráva, která se šíří napříč kanály a časy.
- Prostředí: Navrhněte prostor k podpoře plynulých operací a pohodlných konverzací. V kavárně by rozložení mělo umožnit rychlý přístup k službě, osvětlení by mělo být teplé a akustika kontrolovaná, aby hluk nebránil komunikaci. Prostředí silně ovlivňuje náladu a vnímánou hodnotu a musí zůstat sladěné s vzdělávacími prvky na vystavení.
- Hmatatelné nástroje: Vyvíjejte menu, bloky objednávek, účtenky, šálky a loajální karty, které jsou snadno čitelné a sladěné se značkou. Zahrňte vzdělávací cedule o původu fazolí nebo krocích přípravy; balení by mělo vyprávět krátký, upřímný příběh, který zákazníci mohou sdílet během interakce. Tyto nástroje přispívají k vnímáné expertíze a důvěře; také podporují komunikaci vašich vzdělávacích kampaní a reklamních kampaní zákazníkům.
- Lidé a operace: Školte zaměstnance a poskytovatele, aby následovali standardní signály a scénáře, takže interakce se zákazníky zůstávají konzistentní. Dobře připravený personál odráží design prostřednictvím svého chování, zlepšuje spokojenost a důvěru. Chování směřující k zákazníkům by mělo odrážet hodnoty značky v každém okamžiku.
- Měření: Používejte metriky řízené daty k posouzení dopadu: CSAT, Net Promoter Score, čekací doby a míry řešení při prvním kontaktu. Sbírejte zpětnou vazbu prostřednictvím krátkých průzkumů u pokladny a po službě; analyzujte data týdně k úpravě signálů nebo nástrojů. Tento přístup vyžaduje iteraci a je klíčový pro kontinuální zlepšení.
Příklad scénáře: kavárna v Mexiku přepracovala své on-site materiály s novými menu, vzdělávacími cedulemi o původu a standardizovanými obaly šálků. Sladěním signálů se značkou kavárna zlepšila vnímání zákazníků a zvýšila opakované návštěvy. Sledování řízené daty ukázalo zlepšení v CSAT a rychlejší službu v špičkách, validovalo investici a informovalo o probíhajících kampaních.
Nejlepší praktiky pro rychlé výhry: začněte s nejvýraznějšími signály, zajistěte konzistenci napříč všemi kontaktními body a pravidelně sbírejte zpětnou vazbu od zákazníků. Tři akce k zahájení: revidujte značky, obnovte balení a školte týmy k komunikaci stejného narativu. Každý signál nebo nástroj představuje váš slib v jediném pohledu a lze ho škálovat na jiné poskytovatele nebo lokality. Sladění reklamy napříč kanály pomáhá posílit vzdělávací zprávu a posiluje důvěru zákazníků.
Měření dopadu: jednoduché metriky k sledování výkonu P a dopadu fyzického důkazu
Začněte 4týdenní sprint k měření výkonu P pomocí tří konkrétních metrik: čekací doba, doba do nákupu a CSAT po prodeji, plus skóre fyzického důkazu. Poskytnutí baseline, přiřazení vlastníka pro každou metriku a týdenní revize výsledků převádí poznatky do plánů akcí.
Prostřednictvím teorie Bitnerovo servicescape vysvětluje, jak okolí ovlivňuje pocit a rozhodnutí o koupi. Čistá, dobře osvětlená čekárna, jasné značky a fungující vybavení poskytují signály, které podporují respekt a důvěru; to jde za estetikou k ovlivnění rozhodnutí, zejména v zdravotnictví, kde pečující personál a bezpečné prostředí posilují důvěru, i když interakce probíhají prostřednictvím vzdálených kanálů.
Prvky k sledování zahrnují signály fyzického důkazu (čistota, jasnost značek, pohodlí sedadel, dostupnost vybavení); signály procesu (čekací doby, doby služby, míra chyb); a signály lidí (zdvořilost personálu, znalosti, péče). Představte tyto faktory v jediném skóre, které se sladí s diskuzemi o koupi a konverzacemi po prodeji. Používejte to k informování plánů a personalizovaných zlepšení, které posilují vztahy.
Zdroje dat zahrnují POS data pro nákupy, záznamy servisního pultu, průzkumy po prodeji a terénní audity prostředí. Pro vzdálené kontaktní body přidejte digitální signály jako zprávy na obrazovce a online indikátory čekání. Aktualizujte metriky týdně a benchmarkujte proti konkurenci k identifikaci mezer ve službách a podpoře po prodeji; převádějte výsledky do konkrétních akcí pro další kurz zlepšení.
Kroky implementace k zvážení: definujte časově omezený kurz akcí s jasnými rolemi; spusťte rychlá zlepšení v oblastech s vysokou návštěvností; sledujte související výsledky; upravte plány na základě učení. Udržujte zákazníky zapojené prostřednictvím včasného následování. V zdravotnictví a jiných organizačních kontextech poskytujte udržitelnou pozornost pečujícímu chování a vztahům; to vám pomůže udržet zákazníky zapojené prostřednictvím včasného následování.
| Metrika | Definice | Zdroj dat | Frekvence | Cíl / Benchmark | Akce |
|---|---|---|---|---|---|
| Čekací doba | Průměrné minuty od příjezdu do zahájení služby | POS záznamy, servisní pult | Týdenně | ≤ 5 minut ve většině oddělení | Posun personálu, optimalizace toku fronty, přidání vzdálené registrace |
| Doba do nákupu | Čas uplynulý od prvního kontaktu do nákupu | CRM, POS | Týdenně | Snížení o 10 % týden po týdnu | Objasněte další kroky, snižte předávání, poskytněte možnosti na místě |
| Nákup | Díl kontaktů, které vedou k nákupu | POS, analýzy | Týdenně | ≥ 20 % | Personalizujte nabídky, sladěte zprávy s pocitem a péčí |
| CSAT po prodeji | Skóre spokojenosti zákazníků po službě | Průzkumy po prodeji | Týdenně | ≥ 85 % | Řešte bolestivé body, uzavřete smyčku zpětné vazby |
| Skóre fyzického důkazu | Složené skóre signálů prostředí | On-site audity, vzdálené kontroly | Měsíčně | ≥ 8/10 | Zlepšete čistotu, značky, dostupnost vybavení |
Ready to leverage AI for your business?
Book a free strategy call — no strings attached.


