Core Web Vitals - サイトのパフォーマンスを向上させるための究極ガイド


今すぐLCP、FID、CLSを測定し、最初のスプリント内でトップの違反者を修正してください。 開発者にとって、これは重要です。なぜなら、小さな調整がインタラクティビティと感知される速度で大きな成果をもたらすからです。目標:75パーセンタイルユーザーのLCP 2.5秒未満、FID 100 ms未満、CLS 0.1未満。
アセット最適化はビジュアルを超えます。 画像をAVIFまたはWebPに圧縮し、レスポンシブパイプライン経由で配信し、使用されていないCSSとJavaScriptを削除してください。これにより、多くのデバイスで数秒以内の読み込み時間を短縮し、インタラクティビティを向上させます。JavaScriptペイロードの20–30%削減はLCPとTTIのさらなる改善をもたらし、サードパーティスクリプトは負の影響を監査すべきです。有用なルール:外部ソースからのアイテムを最小限に抑え、低遅延の信頼できるブランドを優先し、Googleの推奨はしばしば注目に値します。
次のステップを推進するためのインタラクティビティに焦点を当ててください。 メインスレッド上の長時間タスクを監査し、重いライブラリを削減し、優先アイテムを最初に配信するためのコード分割を実装してください。この直接的なアプローチは、インタラクティビティまでの時間に重要であり、負のUXシグナルを減少させます。1回の開発サイクル内で、メインスレッドの作業を30–50%削減でき、これにより入力応答が速くなり、ブランドの認識が向上します。
アイテムを週次で測定するリズムを確立し、Google Lighthouseスコアと実際のユーザー指標に直接焦点を当ててください。この慣行は負のトレンドを特定し、次のステップを優先し、既存のページと動的エクスペリエンス全体で進捗を維持するのに役立ちます。ステップバイステップで進むことで、ブランドはユーザー感知速度とインタラクティビティの有意な改善を追跡でき、継続的な作業からのリードがさらなる投資を正当化します。
Core Web Vitalsの測定:実践的な手法とツール
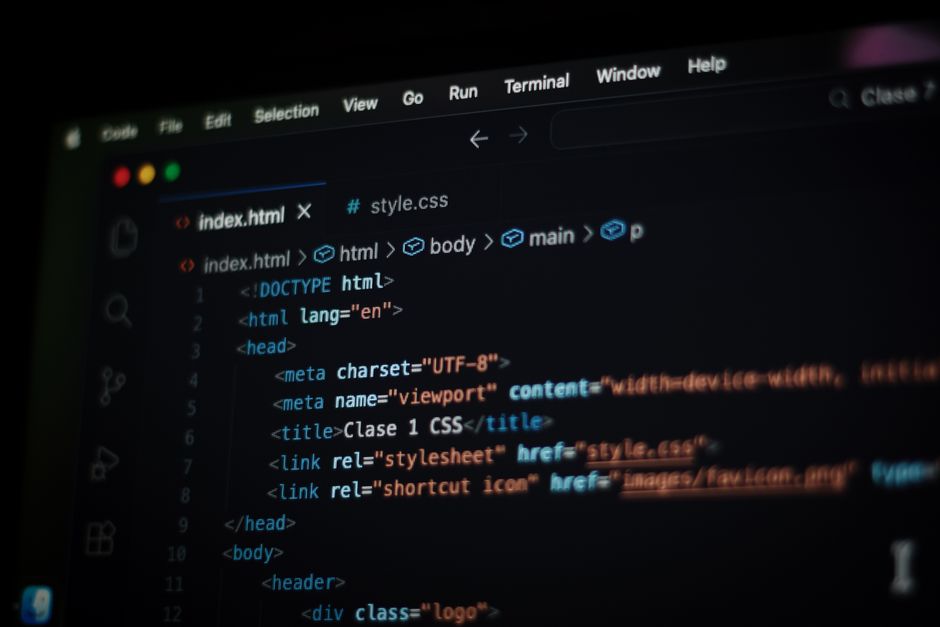
ユーザー認識の核心である測定から始めます:ページごとのチェックは、ペイント時間とフォールド上のコンテンツが感知される速度をどのように駆動するかを明らかにします。これらは単なる数字ではなく、影響力のある実行可能なシグナルです。明確な計画を持つことで、チームは指標を具体的な行動に変えることができます。
1280pxと1440px幅のデスクトップテストは、リソースの順序がCLSとLCPにどのように影響するかを捉えます。Lighthouse、PageSpeed Insights、Chrome UX Reportでラボスキャンを実行し、実際のユーザーの訪問ベースのフィールドデータと比較できるレポートを生成します。その後、所見をチームに渡して遅延を優先してください。
実践的なワークフローとして:各ページを監査してブロック要因を特定し、行動を起こします:オフスクリーン画像を遅延読み込み、非クリティカルスクリプトを最小化・遅延し、フォント読み込みを最適化します。これらはペイント遅延の一般的な原因なので、フォールド上のリソースから始めることでページごとの迅速な改善が得られます。その後、再測定して結果をレポートに渡してください。
測定のリズムとデータソース:訪問ベースのフィールドデータ(Chrome UX Report)とラボ実行(Lighthouse)を組み合わせ、予期せぬ変動を理解します。核心はラボスコアと実世界の結果の相関を最大化することです。数字は完全に一致しないので、ギャップに注意し調整してください。その後、継続的に監視し、時間とともに戦略を調整します。
アクションと指標:速度を最大化するために、画像を圧縮し、適切なキャッシングを有効にし、現代的なフォーマットを配信し、幅対応のレスポンシブ画像を優先してください。コンテンツ更新の場合、ペイントとレイアウト安定性への影響を追跡し、幅変更を使用して一貫したエクスペリエンスを確保します。レポートは合格率とトレンドを示すべきです。ページを定期的に訪問して進捗を検証し、結果が期待に沿うことを確認してください。
目標指標の特定:LCP、FID、CLSの説明
明確な目標を設定:LCP 2.5秒未満、FID 100 ms未満、CLS 0.1未満を目指します。この3つのベンチマークは、初期ロードウィンドウ内でデスクトップとモバイルのウェブページの応答性と安定性をシンプルに示します。ベンチマークの文脈として、ニッチごとにSemrushデータを統合して目標を調整し、内部テストの出発点として使用してください。
- LCP:Largest Contentful Paintは、ロード中にビューポート内で可視の最大要素をレンダリングする時間を測定します。目標:2.5秒未満;3秒は依然として重要な閾値ケースです。実践的なステップ:クリティカルCSSをインライン化、ヒーロー画像をプレロード、表示幅に画像幅を最適化、幅と高さ属性を指定、オフスクリーン画像を遅延読み込み、高速ホスティングプロバイダーを使用して初期遅延を削減。
- FID:First Input Delayは、ユーザーインタラクションからブラウザ応答までの時間を測定します。目標:100 ms未満。50 msを超える長時間タスクがスパイクを引き起こします。実践的なステップ:長時間タスクをマイクロタスクに分割、コード分割、非クリティカルスクリプトを遅延、requestIdleCallbackや類似を使用、重要なスクリプトをプレロード、メインスレッドの作業を最小化。
- CLS:Cumulative Layout Shiftは、ロード中の予期せぬ移動を追跡します。目標:0.1未満。負のシフトはコンテンツが予期せぬ移動をしたときに現れます。実践的なステップ:幅/高さまたはアスペクト比を設定してスペースを予約、画像と埋め込みにサイズ属性を含める、初期レンダー後に既存コンテンツの上にコンテンツを注入しない(広告、埋め込み)、font-display: swapでフォントをロード、レイアウト変更プロパティではなくtransformでアニメーション。
進捗はシンプルなダッシュボードで追跡;現在の値を基準と比較;ドリフトへの対応で調整を追加します。初期測定は長時間タスクと根本原因を特定;デジタルチームはSemrushベンチマークで3つの指標目標をデスクトップの幅変動に合わせて調整できます。エージェントは長時間タスクを監査し、潜在的な最適化を表面化し、視覚と応答性の負の影響を減少させます。
実際のユーザー指標(RUM)と合成テストでパフォーマンスのベースラインを設定
RUM追跡を即座に有効にし、合成テストと組み合わせ、分析に基づく具体的なベースラインを設定します。インタラクションモーメント、初期ロード、応答時間をミリ秒単位でキャプチャし、データ駆動の決定をサポートし、推測を避けます。即時のフィードバックループが調整を強化します。
顧客エクスペリエンスへの影響を考え、チームを観測可能な結果に合わせます。虚栄指標を超えて考え、ユーザーがインタラクトする実際のフローに改善を固定します。
RUMベースラインのコンポーネントには以下が含まれます:
- インタラクション、ナビゲーション、コンテンツレンダリングのイベントレベル追跡;インタラクトまでの時間、pagespeedシグナル、感知応答性を指標に含めます。
- デバイス、ネットワーク、場所によるセグメンテーションで苛立ったセッションとパフォーマンス低下を明らかに;変更の記録を維持してトレーサビリティを確保。
- 指標を顧客結果にリンク、クリティカルパス中の応答時間とコンバージョン影響シグナルを含めます。
合成テストは定義された条件での制御測定を提供します。代表的なデバイスマトリックス、スロットルネットワーク、主なページで実行し、ユーザーがスケールに達する前に遅いパスと誤った設定を特定します。キャッシング、圧縮、遅延読み込みなどの機能を組み込み、チームが行動できる実行可能なレポートを生成します。
目標とリズム:ベースラインデータに基づく数値目標を確立。例えば、pagespeed指標でLCP ≤ 2,500 ms、FCP ≤ 1,500 ms、TTI ≤ 5,000 ms、CLS ≤ 0.1を目指します。初期と継続的な値を追跡;数字が低下したり遅いままなら、トリガーや実装詳細を調整し、必要に応じて閾値を厳しくします。チームに改善の明確な到達点とキー f low でのミリ秒遅延削減計画を与えます。
ワークフローと所有権:進捗を追跡するツールを割り当て;結果を管理者がレビューできるレポートに統合。単一のアナリティクスとテストアカウントを使用して修正の遅延を避けます。問題が発生したら、クイックウィンを実装し、顧客の苛立ちを減らし応答性を向上させる行動の遅延を避けます。行動を逃すと、成長が潜在力を達しません。
実践的なヒント:ページレベルのリソースを監査、レイアウト変更中の安定性を検証、トランジション全体でシームレスな機能を維持。クリティカルパスの監視を含め、データを成長を駆動する実行可能なステップに翻訳します。
クイックウィンのための実行可能なステップ:
- 初期データのために追跡と合成テストを並行して開始。
- ベースライン所見に基づくpagespeedとインタラクションの閾値を定義。
- レポートを定期的にレビューし、洞察を顧客応答と満足を向上させる修正に変換。
Lighthouse、PageSpeed Insights、Chrome UX Reportを活用した実行可能なデータ
統一されたデータフロから開始:Lighthouse、PageSpeed Insights、Chrome UX Reportが単一のダッシュボードにフィードします。このデータはデスクトップとモバイルでの迅速な決定を駆動し、どのアイテムが感知速度を駆動し、どのものがそうでないかを学びます。
デスクトップとモバイルのLighthouse監査を実行してラボスコアと実行可能なギャップをキャプチャ。LCP、CLS、ブロック時間に焦点;詳細なトレースと影響を受けるページのリストをエクスポート。PSIでより広い文脈を組み合わせ;CrUXはフィールド行動を明らかにし、改善が実際のユーザーに届くかを示します。これはラボデータなしで焦点を当てるのが不確かな開発者とパブリッシャーに特に有用です。技術的ブロックと欠落リソースは進捗を停滞させ;これらを対処することでしばしば迅速なイテレーションが得られます。ダッシュボード全体を見ることでパターンを確認します。
クイックウィンのオプションを作成:クリティカルリクエストを最適化、キャッシングを有効に、アセットを圧縮、非クリティカルスクリプトを遅延。トライアル修正を実行し、PSIとCrUXで影響を測定;デスクトップの獲得はモバイルと異なりますが、欠落リソースに対処した後でより広い効果が現れます。スコアは依然として上昇し、システムは速くなり、開発者は次のステップのためのより良いシグナルを得ます。パブリッシャーは変更が翻訳されるか不確か;ページ全体のパターンを見てより広いリーチを駆動。数個のクイックウィンを追加。
Googleツールチェーンは既存のパイプライン内でアウトカムを測定し、デリバリーをブロックしません。単一のツールを使用してLighthouse結果、PSIスコア、CrUX指標を週次で収集。変更を公開する前に、ローカルトライアルを実行して結果の方向を確認;スコアが正しい方向に動けば、調整を広く実装。重要:修正をビジネスニーズとより広いシステム目標に合わせ;これにより予備所見から本番改善への明確なパスが作成されます。
LCP、CLS、FID値の解釈:ページタイプ別のベンチマーク
推奨:製品とチェックアウトページでメイン レンダー後に非同期スクリプトを移動し、LCPを2.5 s未満に削減;これにより応答性が向上し、遅延が低下し、スムーズな視覚結果が得られます。
ページタイプ別のベンチマークは既存のレイアウト、サーバー、場所の結果を提供します。この監査は行動のためのベースラインを提供し、ランディングからの洞察がギャップを特定し改善をガイドします。
視覚シグナルと既存のレイアウト詳細から学び、行動を駆動し、他のタスクをインターネット場所とサーバー設定全体でスムーズで応答性のあるものに保ちます。
| ページタイプ | LCP (s) | CLS | FID (ms) | Notes | Action |
|---|---|---|---|---|---|
| ホームページ | 2.8 | 0.12 | 110 | Heavy hero, several elements above fold | Reserve space, inline CSS for critical parts, lazy-load non-critical assets |
| 製品ページ | 2.1 | 0.05 | 85 | Image gallery and specs load early | Use image CDN, preload primary images, defer non-critical scripts |
| カテゴリーページ | 3.5 | 0.15 | 120 | Filters and lists trigger reflow | Implement virtualization, skeletons, and precompute ranks |
| ブログ投稿 | 1.9 | 0.04 | 60 | Text blocks; images optional | Compress images, lazy-load media, preconnect fonts |
| チェックアウトページ | 4.2 | 0.25 | 180 | Form widgets and payment iframe | Split into steps, defer third-party scripts, prefetch critical calls |
| サポートページ | 1.6 | 0.03 | 70 | FAQ accordion; little dynamic height | CSS-driven states, avoid height changes, optimize scripts |
FIDとTBTの対処:JavaScript最適化とメインスレッド削減

最初のインタラクション後に非クリティカルJavaScriptを遅延することで、ほとんどのデバイスでFIDを100 ms未満に保ち、典型的なページでTBTを30–60%削減します。dynamic import()経由で3つの小さな非同期チャンクを挿入し、フォールド上のコードを優先することでクリックが即時的に感じられ、UXを形成する勝ちを手に入れます。これらのステップはユーザー満足とランキングに有意な影響を与えます。
コード分割と遅延読み込みを採用;未使用モジュールを削除;長時間タスクを小さな作業単位に変換。requestIdleCallbackやスケジュールされたマイクロタスクを使用してレンダリングに制御を返す、イベント委譲を適用してリスナーを削減、サードパーティウィジェットをインタラクティブになるまで遅延。これらを組み合わせ、すべてのページでロードするオーバーサイズライブラリから離れて予算を厳しく保ちます。
アナリティクスダッシュボードとLighthouse監査を通じて測定すると、JavaScriptワークロードを削減した後でランキングの有意な改善に気づきます。フォールド上のペイントはアセットが優先されると改善し、重いライブラリの負の影響は非クリティカルスクリプトの遅延で緩和されます。これによりメインスレッドの作業が折り畳まれます。これによりエンゲージドセッションの報酬が得られます。監査所見は3つの具体的な行動を形成するのに役立ちます:(a) 総メインスレッド作業を縮小、(b) 重いライブラリを縮小、(c) 非必須機能を延期。
出典:内部監査ノート。
Ready to leverage AI for your business?
Book a free strategy call — no strings attached.


