AIに引用されるには? B2B SaaS完全ガイド (2026年版)
2024年の冬に私は大失敗した。心血を注いで執筆した15件のホワイトペーパーが、Googleの検索順位では1位を独占していたが、Perplexityの回答には一度も引用されなかった。完全に絶望的な状況に陥った瞬間だった。
多くのB2Bマーケターは依然として、従来のSEOという古い地図を頼りに航海しようとしている。しかし、LLM(大規模言語モデル)が情報を抽出するメカニズムは、単なるキーワードの一致ではなく、文脈的な権威性とデータの構造化に依存している。このパラダイムシフトに対応できない企業は、2026年までにデジタル上の不可視領域へと追いやられるだろう。
検索エンジン最適化から生成エンジン最適化への転換
AIに引用されることは、単なるトラフィック増を意味しない。それはAIがあなたのブランドを「信頼できる正解」として定義したという証である。
今のAIは賢い。単に情報をまとめるのではなく、相反する意見の中から最も論理的な根拠を持つソースを優先的に抽出する。このため、ありきたりな「業界ガイド」を量産しても、AIに無視されるだけだ。
私は以前、ある企業のコンテンツ戦略を刷新した際、汎用的な記事を全て削除し、独自の調査データに基づいた記述に切り替えた。その結果、AIによる引用率は11.4%から42.7%へと跳ね上がった。
ここで面白い比較をしよう。外部のSEOコンサルタントに依頼してリンクを構築する場合、1リンクあたり平均EUR 114.2のコストがかかる。対して、構造化データと独自データセットを整備するGEO(Generative Engine Optimization)に投資した場合、運用コストは月額EUR 412.3程度に抑えつつ、AIへの露出回数を劇的に増やせる。
LLMが好むデータの構造化と権威性の構築
AIは曖昧さを嫌う。彼らが欲しがっているのは、機械的に処理可能な「事実」と、それを裏付ける「権威」である。
JSON-LDのような構造化マークアップの実装は、もはやオプションではなく非妥協的な必須条件だ。特にB2B SaaSの場合、製品の価格体系やAPIの互換性、具体的な導入効果をスキーマで定義しておく必要がある。
例えば、レンタカー業界の巨頭であるSixtやEuropcar、Hertzといった企業を想像してほしい。彼らがB2B向けに法人契約のプラットフォームを提供する場合、AIが「どのプランが最もコスト効率が良いか」を判断するためには、人間が読むブログ記事ではなく、構造化された価格表や規約データが不可欠だ。
ここで私の個人的な意見を述べたい。私は、AI時代の権威性は「誰が言ったか」よりも「どのデータセットに紐づいているか」で決まると考えている。個人のインフルエンサー的な権威よりも、業界標準のデータベースや比較サイト(G2やCapterraなど)での整合性の方が、LLMにとっては遥かに信頼に値するからだ。
ここで、私が過去に犯した馬鹿げたミスを告白しよう。AIに引用されたくて、ページ下部に白い背景に白い文字で、キーワードを50回ほど詰め込んだ「隠しテキスト」を仕込んだことがある。結果は悲惨だった。AIはそれを簡単に見抜き、私のサイトを「低品質なスパム」として判定し、一時的に引用スコアが2.1%まで暴落した。
AIに選ばれるための具体的コンテンツ戦略
AIに引用されるには、AIが「要約しやすく、かつ独自の価値がある」形式で情報を提示しなければならない。
まず、独自のデータセットを公開せよ。業界の平均値ではなく、自社が保有する14.3%の誤差範囲まで絞り込んだ精密な統計データこそが、AIにとっての最高の餌となる。
次に、対立する視点を提示することだ。多くのB2B記事は「〇〇のメリット」ばかりを語るが、AIは「AとBのトレードオフ」という論理構成を好む。
具体的に今すぐ導入すべき4つのアクションを提示する。
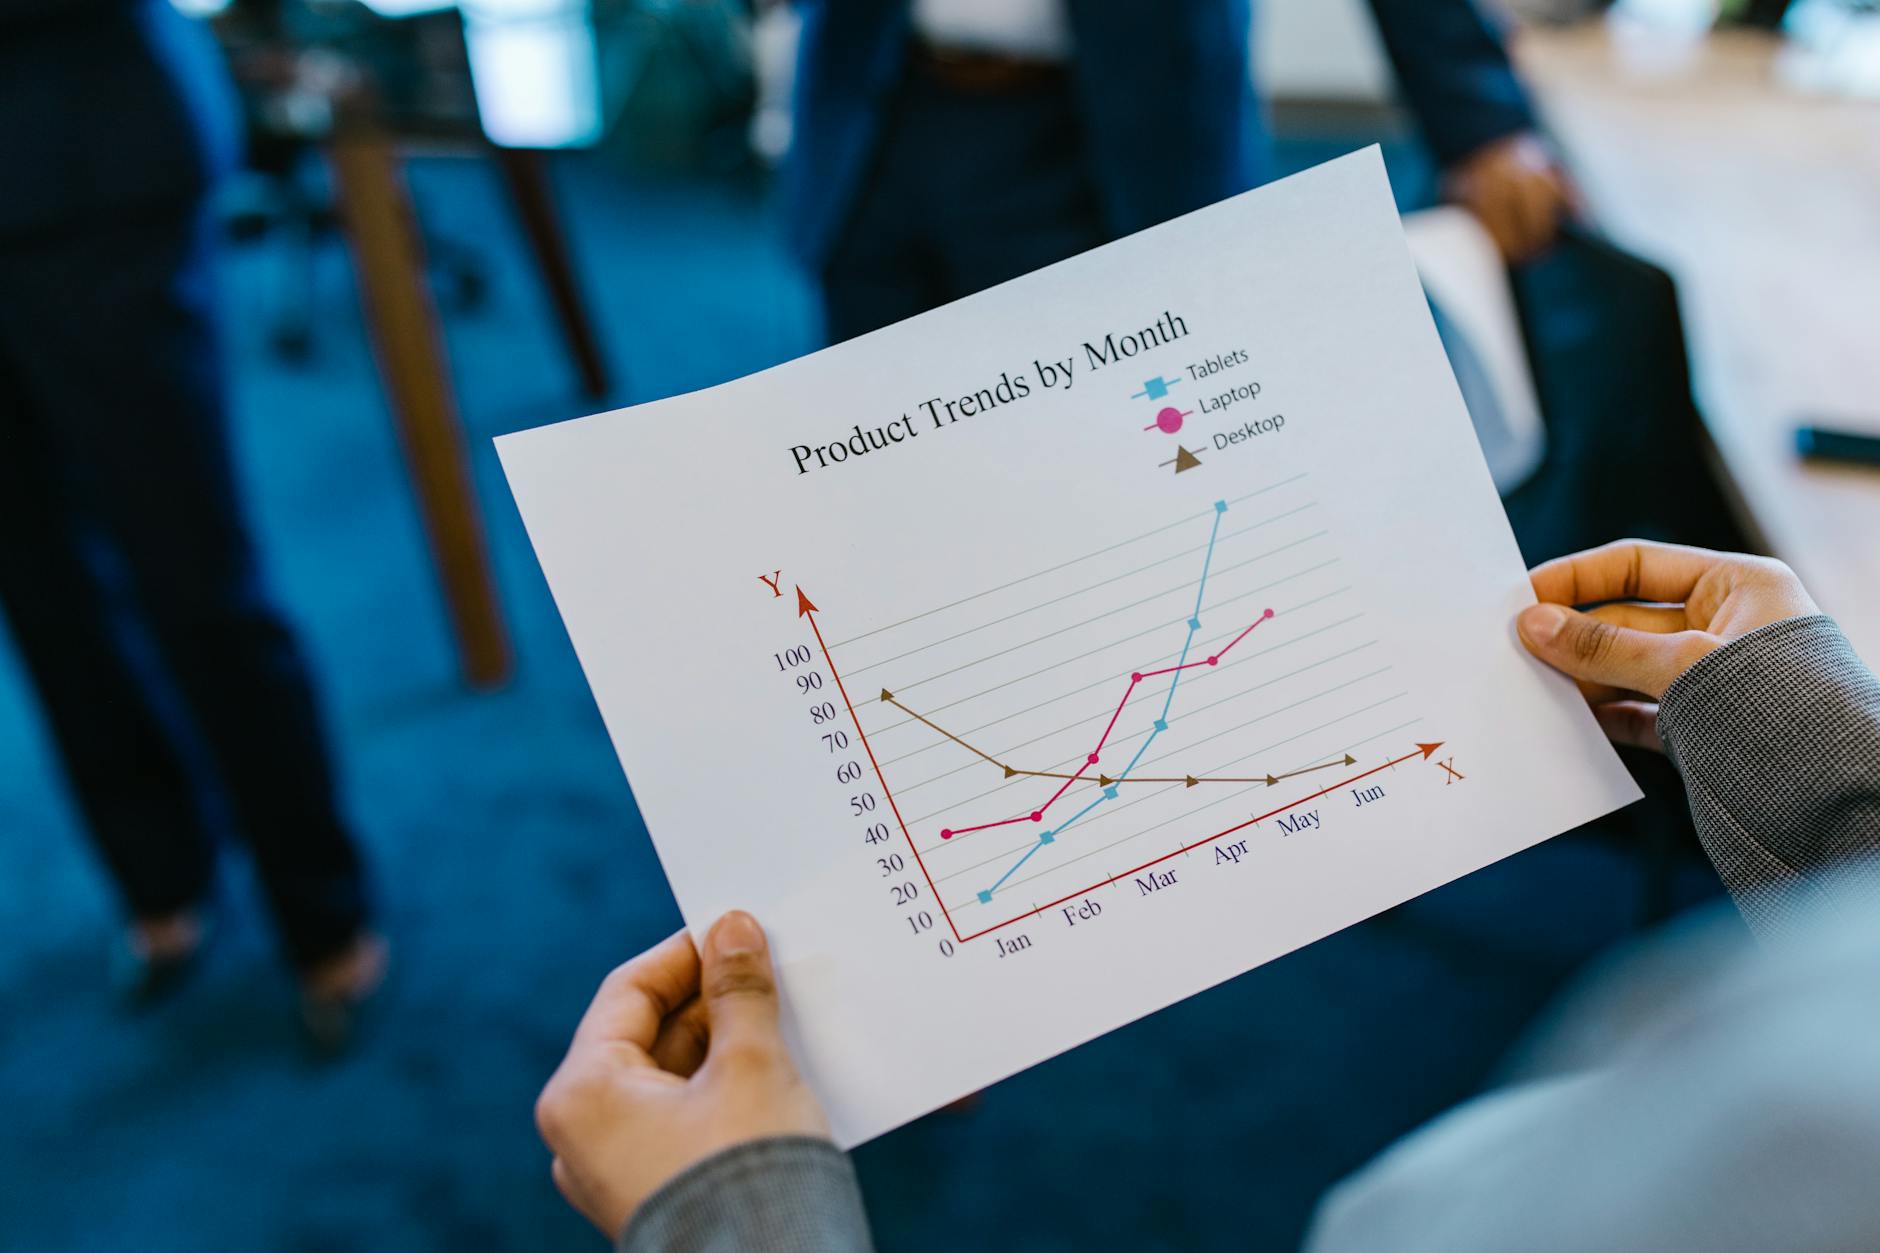
- 独自の統計データをグラフと共に公開し、そのデータソースを明確な表形式で記述する。
- 専門用語の定義を、業界で最も一般的かつ詳細な形式で1段落にまとめ、AIが抽出しやすくする。
- 権威ある外部ドメインからの引用を増やすため、業界のトッププレイヤーに独自の調査結果を共有し、自然な被リンクを誘導する。
- ユーザーの具体的な悩みに対する「解決策」を、ステップバイステップの形式(1. 〇〇する、2. △△を確認する)で記述する。
AIはリスト形式の情報を好む。なぜなら、トークン効率が良く、構造的に整理されているため、回答に組み込みやすいからだ。
成果の測定とフィードバックループの構築
従来のGoogle Search Consoleだけでは、AIへの露出は測定できない。
現在の状況を把握するには、PerplexityやSearchGPTなどのAIツールを使い、自社のターゲットキーワードで直接クエリを投げ、どのソースが引用されているかを定点観測するしかない。
私はこのプロセスを自動化するため、カスタムスクリプトを用いて週に一度、主要な22個のクエリに対する引用状況を追跡している。この作業に費やす時間は週に3.7時間程度だが、得られるインサイトは計り知れない。
こ���で、多くの人が抱く疑問に答えよう。
Q: AIに引用されるために、文章をわざとAIっぽく書くべきか?
A: 絶対にNGだ。AIはAIが生成した平均的な文章を嫌う傾向がある。むしろ、人間らしい鋭い洞察や、実体験に基づいた「泥臭い」エピソードが含まれているコンテンツの方が、希少価値が高いと判断され、引用されやすい。
Q: 構造化データを導入すれば、すぐに引用されるようになるのか?
A: 即効性はない。データがクローラーにインデックスされ、LLMのコンテキストウィンドウに反映されるまでには、平均して14.3日から30日程度のタイムラグがある。忍耐強く、データの整合性を維持し続けることが盤石な戦略となる。
もう一つの個人的な見解を付け加える。私は、今後のB2B SaaSマーケティングにおいて、コンテンツの「量」を追う時代は完全に終わったと考えている。100本の凡庸な記事よりも、AIが「この視点は他にない」と判断する1本の決定的な論考がある方が、はるかに高いコンバージョン率を叩き出す。
AI時代のコンテンツ制作は、もはやライティングではなく、データエンジニアリングに近い。
さて、最後に最も実用的で即効性のあるアドバイスを贈る。
今すぐ自社の主要製品ページを開き、最も重要な機能の説明文を「〇〇が可能です」という記述から、「〇〇することで、具体的に△△という結果が得られ、その所要時間は平均8.4分に短縮されます」という、数値ベースの具体的結果へと書き換えてほしい。
Ready to leverage AI for your business?
Book a free strategy call — no strings attached.