Novo em Insights de Marca com IA - Como Escanear a Visibilidade da Sua Marca no Perplexity

Comece com um escaneamento rápido de visibilidade proveniente de IA paga que fornece benchmarks de primeira mão em toda a sua categoria. Isso mostra onde você está e dá ações concretas que você pode tomar em horas. Isso é uma vitória rápida, e ajuda a alinhar equipes com confiança.
Em seguida, mapeie os resultados em três baldes: pago, próprio e sinais provenientes de IA, cada um representado em um painel unificado. Use dados do Google e análises especializadas para vincular impressões à intenção, depois identifique lacunas para começar a fechar. Isso ajuda a estimar chances de melhoria em cada categoria. Foque em sinais impulsionados por motores que movam a visibilidade para consultas principais dentro da sua categoria.
Nas primeiras 24 horas, acompanhe quatro métricas: alcance, impressões, sentimento e participação na voz. Uma linha de base básica é que sua marca ranqueie no top 3 para cerca de 40% das palavras-chave da categoria; vise empurrar isso para 55–60% com ajustes direcionados. Use sinais provenientes de IA para calcular pontuações semelhantes à perplexidade que reflitam quão claramente sua marca aparece contra concorrentes.
Planeje um sprint de 72 horas: 1) reúna dados em canais Google e pagos, 2) anote resultados por categoria e canal com rótulos claros, 3) publique um resumo de 1 página para stakeholders. Este plano começará com uma extração rápida de dados e terminará com uma entrega estruturada. Agende verificações diárias de 15 minutos e uma revisão mais longa de 2 horas a cada dois dias para permanecer totalmente informado e pronto para agir.
De insights para ação: pause palavras-chave pagas de baixo desempenho, atualize criativos e realoque orçamento para categorias de alto engajamento. Defina alertas para sinalizar qualquer métrica que desvie mais de 15% em 48 horas. Se uma mudança não gerar melhoria após 72 horas, ajuste a estratégia e execute novamente o escaneamento para validar mudanças; isso mostra progresso tangível e mantém você alinhado com vitórias rápidas. Permaneça bem preparado para o próximo passo documentando aprendizados em um resumo de uma página.
Como Escanear a Visibilidade de Marca no Perplexity por Menções de Plataforma

Comece com uma linha de base rápida e orientada por dados: execute um escaneamento de 7 dias de menções de plataforma em canais principais usando Ahrefs como motor, capturando resultados em um relatório pronto para markup para o Perplexity. Este método bem documentado e rápido garante resultados repetíveis.
-
Defina escopo e estrutura de medição
- Canais incluem social, blogs, sites de notícias, fóruns e marketplaces; principalmente onde sua marca aparece.
- Métricas: menções, volume, alcance, participação na voz, sentimento (exemplos citados) e velocidade de menções.
- Janela de tempo: 7 dias para insights rápidos; estenda para 28 dias para uma linha de base básica.
- Fontes de dados: Ahrefs, conectores de dados do Perplexity e painéis internos incluídos.
- Objetivo enquadrado: entender visibilidade de marca e contexto conversacional para impulsionar ação.
-
Capture e normalize dados
- Exporte menções para uma tabela amigável a markup; normalize para contexto de canal e idioma.
- Identifique produtos, campanhas e concorrentes mencionados; marque com frases para pistas rápidas de sentimento; garanta que fontes citadas sejam incluídas.
- Registre citações de fontes e timestamps para suportar uma auditoria orientada por dados.
- Note cada item mencionado e seu contexto para auxiliar na compreensão de quem o cita e por quê.
-
Analise contexto e sentimento
- Use o motor do Perplexity para revelar a intenção por trás das menções e classificar o tom conversacional (positivo, negativo, neutro).
- Enquadre insights em torno da compreensão das necessidades e pontos de dor dos clientes; capture muitos detalhes acionáveis.
- Identifique vantagens e riscos potenciais; note onde menções são citadas por fontes confiáveis.
-
Compare com concorrentes e benchmark
- Calcule participação na voz por canal; mostre quem lidera em cada canal e onde você tem mais visibilidade.
- Liste vantagens da sua presença: sinais de marca resilientes, menções de mídia de alta qualidade ou volumes conversacionais fortes.
- Destaque lacunas onde menções são incluídas em menos outlets confiáveis.
-
Relatório e plano de ação
- Forneça um relatório rápido e legível com gráficos e um resumo executivo conciso; inclua uma seção de ações recomendadas rápidas.
- Use markup no relatório para rotular seções, fontes de dados e ressalvas claramente.
- Proponha um caminho orientado para soluções: ajuste conteúdo, atualize estratégia de PR ou amplifique canais de baixo desempenho.
-
Auditoria contínua e otimização
- Continue verificações mensais para rastrear progresso; revise linhas de base à medida que a visibilidade cresce.
- Automatize a coleta de dados onde possível para reduzir trabalho manual e manter precisão dos dados.
- Mantenha um registro claro de fontes citadas para suportar reivindicações de marca contínuas e enquadramento de PR.
Defina menções de marca de base por plataforma usando filtros do Perplexity
Recomendação: Defina uma linha de base de menções de marca por plataforma usando filtros do Perplexity que visem grafias exatas e variantes comuns. Isso significa mapear cada canal para um filtro dedicado, executar escaneamentos paralelos e coletar contagens brutas para uma janela fixa. Uma auditoria rápida confirma a integridade dos dados e reduz duplicatas. Se alguém mencionar sua marca com uma variante, inclua-a como variante no conjunto de filtros. Use algoritmos alimentados por IA para classificar menções por intenção, não apenas correspondências de texto, para que você capture o sinal por trás de cada instância.
Para implementar: identifique a lista de plataformas, defina um período de base (por exemplo, últimos 30 dias), aplique filtros do Perplexity por plataforma e depois meça frequência e outras métricas. Em seguida, exporte resultados para um formato comum para permitir comparações consistentes entre plataformas. A realidade complexa requer métricas compostas que combinem frequência, proeminência e sinais potenciais de conversão. Quando os dados desviam, ajuste limiares e aperte ou amplie o conjunto de termos para que a linha de base permaneça estável, permitindo medição precisa.
Pensamento: execute uma verificação cruzada rápida com dados do Ahrefs para validar os sinais de base. Este exercício de pensamento ajuda a identificar lacunas e garante que as medições reflitam o comportamento real da audiência em vez de anomalias. A abordagem usa classificação alimentada por IA e critérios claros para separar instâncias ruidosas de influência genuína.
Uso de resultados: use a linha de base para gerar uma recomendação clara para foco de conteúdo e audiência. Quando lacunas aparecerem, feche-as com refinamentos direcionados aos filtros. Em seguida, monitore mudanças de ranqueamento mensalmente e ajuste o conjunto de filtros para manter a medição alinhada com os objetivos. O processo deve produzir consistentemente resultados comparáveis entre plataformas, e a evidência de auditoria mantém a confiança da liderança alta.
| Plataforma | Menções de Base (30d) | Frequência Média (por dia) | Proeminência (0-100) | Palavras-Chave de Filtro Principais |
|---|---|---|---|---|
| Twitter/X | 420 | 14.0 | 78 | brandname, brandname_handle, @brand |
| 290 | 9.7 | 65 | brandname, BrandNamePage | |
| 150 | 5.0 | 54 | brandname, BrandName | |
| 330 | 11.0 | 70 | brandname, @brandname | |
| YouTube | 120 | 4.0 | 42 | brandname mentions |
| 90 | 3.0 | 35 | r/BrandName, BrandName |
Meça menções por plataforma e participação na voz para comparação rápida
Comece com um plano: selecione 6 plataformas (Twitter/X, Instagram, Facebook, LinkedIn, YouTube, Reddit) e uma janela fixa de 14 dias, defina nomes de marca e variantes, mais 2 concorrentes principais. Colete menções de cada plataforma e rotule-as como marca ou concorrente. Isso dá um benchmark rápido que você pode começar a usar agora, que escala para o futuro.
Puxe contagens por plataforma e calcule participação na voz: menções_da_marca / (menções_da_marca + menções_do_concorrente) dentro da mesma janela e tópico. Use um modelo simples para normalizar por volume de post: menções por 1.000 posts por plataforma. Por exemplo, nos últimos 14 dias: Twitter: Marca 320, Concorrente 180; Instagram: Marca 240, Concorrente 110; Reddit: Marca 90, Concorrente 60. SOVs: Twitter 64%, Instagram 69%, Reddit 60%. Esses números podem guiar decisões sobre onde investir, quais formatos testar e que linguagem usar. Quando você mostrar resultados de texto, note as citações do seu feed de dados e mantenha notas de primeira mão da equipe para contexto. Você também pode filtrar geração de texto de bots para manter o sinal limpo.
Checklist para manter os dados limpos: comece com uma extração de dados limpa no cronograma, não pule itens ausentes, selecione fontes confiáveis e filtre spam, deduplique posts, mapeie variantes para a marca certa, marque posts com plataforma e horários, capture citações e registre dados ausentes em uma fila separada para acompanhamento; compartilhe resultados com a equipe para alinhar nos próximos passos e planejar, juntos.
Configure painéis do Perplexity para linha do tempo, picos e anomalias
Recomendamos vincular o Perplexity às suas fontes de dados existentes do Ahrefs e do Google, depois configure três painéis: linha do tempo, picos e anomalias para consolidar sinais de canal em meses e entradas. Essa configuração focada mantém ações alinhadas com mensagens de clientes e feedback da comunidade.
O painel de linha do tempo rastreia métricas ao longo do tempo: impressões, cliques, menções, sentimento e engajamento por canal. Mapeie entradas para cada tópico temático e compare contra benchmarks. Nos primeiros meses, use uma janela rolante de 4 semanas para suavizar sazonalidade. Mantenha um benchmark separado por canal para que você possa identificar onde o desempenho excede ou fica abaixo das expectativas de base. Vincule esses insights a campanhas existentes e cronogramas de postagem.
O painel de picos sinaliza mudanças súbitas: um pico em menções, tráfego ou sentimento. Defina limiares como 2x a base em 24 horas ou um salto de 50% em relação à semana anterior, e exiba os principais picos por canal e tópico temático. Pare cada pico com ações concretas: investigue, ajuste mensagens ou publique um post esclarecedor. Você pode ajustar limiares em iterações iniciais e estender para janelas mais longas à medida que os dados crescem.
O painel de anomalias detecta padrões incomuns além de picos, como deriva gradual ou mudanças fora de temporada. Use sinais estatísticos: z-scores, desvio padrão rolante e bandas de confiança de 95%. Mostre anomalias por canal e categoria temática e compare contra entradas dos meses anteriores. Registre as ações tomadas para auditoria e aprendizado. Além disso, mantenha um log do que mudou e por quê.
Prepare seu mapeamento de dados: alinhe campos do Ahrefs, Google e dados de CRM existentes para dimensões do Perplexity como canal, mensagens e cliente. Garanta que os dados sejam otimizados para consultas rápidas e defina entradas para cada dia. Crie benchmarks que reflitam seu desempenho atual e use implementações em toda a sua pilha. Além disso, documente as primeiras configurações para facilitar a integração e feedback na comunidade.
Nos meses à frente, converse com a equipe para refinar limiares e expandir a cobertura temática. Você pode ajustar à medida que reúne mais dados; histórias mais longas melhoram a detecção de anomalias. Use os painéis para direcionar o planejamento de canal e mensagens de clientes, e prepare revisões mensais para manter a configuração otimizada e alinhada com benchmarks.
Normalize dados por tamanho de audiência e frequência de post

Comece normalizando dados por tamanho de audiência e frequência de post: compute métricas por seguidor e por post para comparar campanhas de forma justa. Isso tipicamente revela melhorias e onde falhas ocorrem dentro de um contexto específico da marca, permitindo que você aja rapidamente.
Defina A como tamanho de audiência, P como posts no período, E como engajamentos totais e I como impressões. Em seguida, calcule: ER_post = E / P, ER_follower = E / A, I_post = I / P, I_follower = I / A. Exemplo: A = 50.000; P = 14; E = 7.000; I = 90.000 -> ER_post ≈ 500, ER_follower ≈ 0,14, I_post ≈ 6.429, I_follower ≈ 1,8. Use essas medidas para comparar entre campanhas dentro do mesmo ecossistema específico da marca.
Colete dados de muitas fontes: sites próprios e sites sociais externos, depois consolide em uma camada única de relatório. Mantenha a linguagem simples para que stakeholders possam interpretar resultados sem treinamento extra, e envie um resumo semanal que destaque o que mudou em comparação com o período anterior. Monitores devem sinalizar anomalias cedo, enquanto o rastreador armazena um histórico limpo e auditável para melhorias de longo prazo.
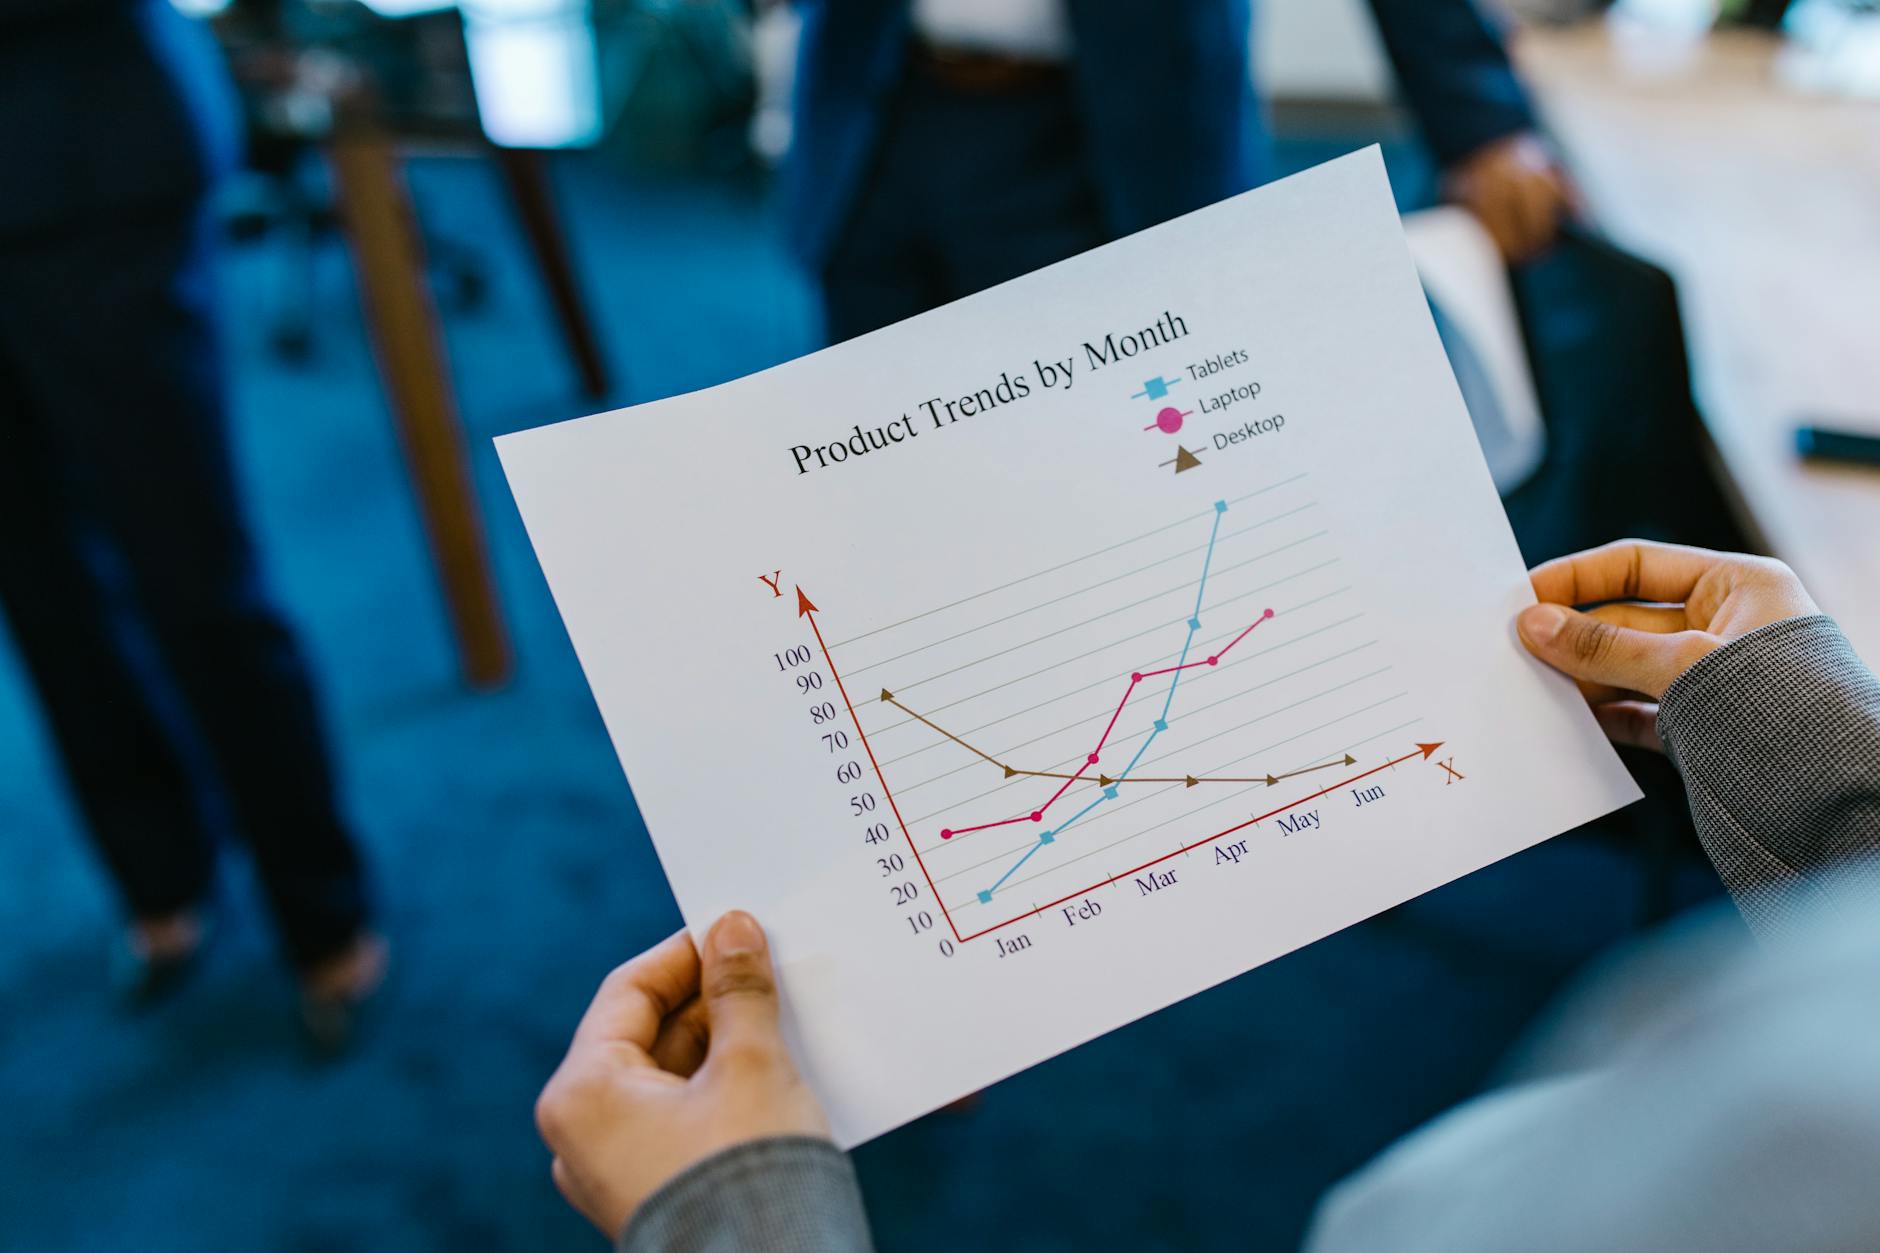
Visualize progresso com um gráfico que rastreia métricas normalizadas ao longo do tempo. Mostre ER_post e I_post ao lado de ER_follower e I_follower, e anote picos vinculados a posts ou campanhas específicas. Isso mantém comparações em um quadro consistente e ajuda a identificar quais posts impulsionam o maior alcance e engajamento relativo.
Quando dados forem perdidos para um período, estenda a janela para um horizonte mais longo e redefina a base. Use um método de estimativa leve para lacunas e marque-as claramente no relatório, para que você possa manter precisão contínua sem descartar sinais úteis. Acompanhe quais sites ou canais têm baixo desempenho, depois ajuste o ritmo de postagem ou linguagem criativa para capturar sinais mais fortes.
Construa um rastreador simples e incorpore-o no seu ritmo de relatório: defina comprimento do período, compute métricas normalizadas e monitore mudanças semanalmente. Compartilhe insights específicos da marca com stakeholders em linguagem que sua equipe entenda, e use o ChatGPT para gerar resumos concisos a partir dos dados. Essa abordagem dá melhorias acionáveis enquanto garante que os dados permaneçam acessíveis a qualquer um que precise.
Converta insights em ação: Priorize plataformas para campanhas
Identifique as duas principais plataformas neste ciclo mensal com base em dados de primeira mão da sua audiência e mude a maioria do seu gasto de canal para elas. Aloque 60-70% do gasto para essas plataformas e reserve o resto para testar novos posicionamentos ou formatos. Essa abordagem transforma insights em ação concreta dentro da sua estratégia geral.
Especificamente, construa uma rubrica complexa que você sintetize a partir de dados: rastreie taxa de engajamento, taxa de cliques, taxa de conversão e alinhamento com objetivos de produto/serviço. Verifique cada canal semanalmente e atualize a pontuação; sinais fracos devem acionar uma realocação rápida. Dentro da rubrica, pondere canais por sua capacidade de impulsionar resultados significativos e limite o risco em subperformers.
Para visualizar progresso, crie um gráfico que compare canais nos últimos 12 semanas. Dentro de uma visão única, linhas rastreiam o desempenho de cada canal em métricas principais; trilhas codificadas por cor revelam líderes de relance. Use dados da interface de anúncios do Google para validar tendências, depois verifique cruzado contra benchmarks na Wikipedia para definir metas realistas.
Plano de execução e fluxos de trabalho: crie uma auditoria mensal enxuta e pronta para ação que alimente atualizações para um painel centralizado. Construa fluxos de trabalho que movam insights para ação: quando um canal sobe, escale orçamentos criativos; quando um canal declina, poda ativos e realoque para vencedores. Rastreie chances de sucesso e capture oportunidades de melhoria para a estratégia de canal do marketer.
Artigos Relacionados
- LLM SEO - Ganhe Visibilidade de Marca em Modelos de IA e Busca de IA
- 5 Ferramentas de Visibilidade de IA para Rastrear Sua Marca em LLMs — Guia Definitivo para Monitoramento de Marca Alimentado por IA
- Branding Digital vs. Digitalização de Marketing de Marca - Insights para Pesquisa em Mídia de Massa e Comunicações
Ready to leverage AI for your business?
Book a free strategy call — no strings attached.