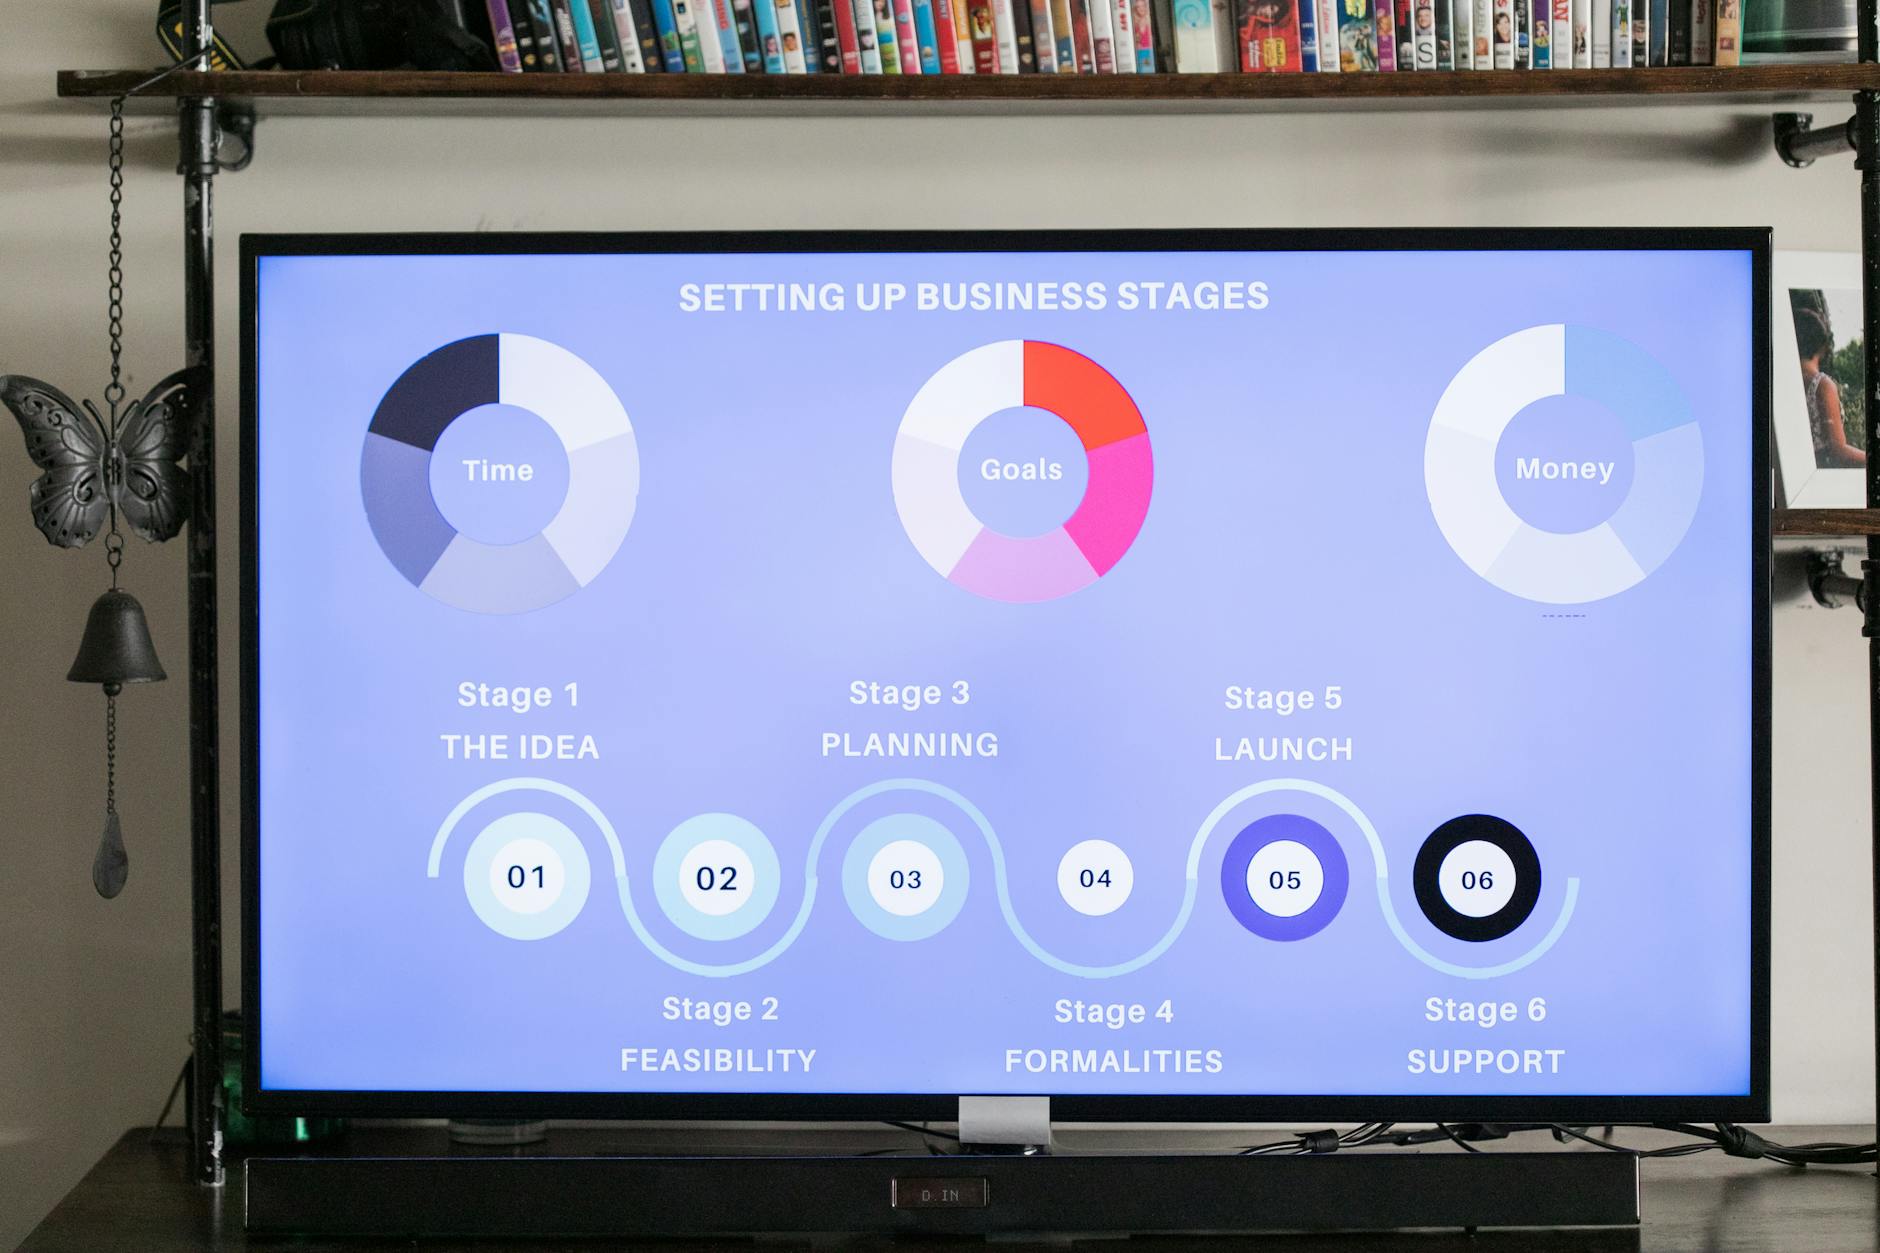
9 ключових етапів у вашому процесі маркетингових досліджень - Практичний покроковий посібник

Почніть з односторінкового брифу та сфокусованої анкети, яка фіксує демографічні дані, ставлення та минулі поведінки респондентів. Зберіть факти на репрезентативній вибірці, щоб мати солідну основу для рішень. Визначте єдину вимірювану мету цього дослідження та узгодьте всіх у компанії навколо неї. Використовуйте помірний розмір вибірки, який балансує точність і швидкість; прагніть щонайменше 200 респондентів для онлайн-опитувань, щоб виявляти середні відмінності з упевненістю, тоді як менші цільові дослідження можуть розкривати практичні інсайти для конкретних сегментів клієнтів.
Потім встановіть план даних, який керує збором через канали, канали можуть бути онлайн, в магазині чи кол-центрі; забезпечте використання тих самих питань, щоб дані залишалися порівнянними. Створіть основу для аналізу, позначаючи кожну відповідь демографічними даними, місцезнаходженням та областю продукту на основі чітких критеріїв. Підготуйте графіки та таблиці заздалегідь, щоб ви могли бачити тенденції негайно, а не чекати фінальних звітів. Це тримає проект у русі та допомагає прискорювати рішення для компанії.
Під час збору даних підтримуйте якість, валідуючи відповіді та перевіряючи на дублікати чи шахрайські записи. Використовуйте потужний план вибірки, щоб досягти різноманітного набору індивідуумів та респондентів, включаючи деякі крайні випадки для тестування ставлень та очікувань. Тримайте фокус на приватності та згоді, щоб захищати довіру та відповідність. Факти, які ви збираєте, повинні бути відстежуваними до чіткої основи питань, які ви поставили.
Після збору проведіть компактний аналіз, який повідомляє середнє за сегментом та порівнює те саме питання через демографічні дані. Створіть графіки та виконавчі зведення, які виділяють можливості для покращення відповідності продукту ринку, ціноутворення чи повідомлень. Обґрунтуйте інсайти фактами та уникайте надмірної генералізації; використовуйте основу спостережуваної поведінки, щоб пропонувати практичні та практичні дії.
З дев'ятьма етапами в полі зору, тримайте простий ритм: добрий план, швидкі переходи до інсайтів та короткий огляд, щоб підтвердити, що рухає стрілку для компанії. Використовуйте інсайти, щоб прискорити розробку продукту, вдосконалити кампанії та підтримувати імпульс через команди. Практичний покроковий цикл допомагає вам покращувати результати та будувати потужний трек-рекорд успіху.
Фаза 1: Визначення цілей, обсягу та зацікавлених сторін
Визначте п'ять чітких цілей, пов'язаних з вибраними аудиторіями та бізнес-рішеннями, та представте їх у стислій презентації для затвердження.
Визначте, яке рішення інформує кожна ціль, які ринки в обсязі та які дані потрібні для керування діями.
Встановіть обсяг точно: географія, продуктові лінії та часовий проміжок, плюс покрокові кроки для збору даних, валідації та аналізу.
Перелічіть зацікавлених сторін: виконавців, менеджерів продукту, маркетологів, урядових партнерів та ключові групи респондентів з визначеними ролями.
Створіть власність: призначте власника для кожної цілі, елемента обсягу та групи зацікавлених сторін, та встановіть єдину точку контакту.
Визначте використання та контроль доступу, щоб команди могли витягувати повні набори даних, залишаючись відповідними.
Побудуйте покроковий план комунікації: коротку справу, п'ятипунктний чек-лист та односторінковий брифінг для поширення з аудиторіями.
Процес для респондентів: спроектуйте підхід опитування чи інтерв'ю, щоб уникнути втрати респондентів та забезпечити легкі, вищі ставки відповідей.
З самого початку узгодьте план з виконавчими рішеннями та потребами урядової звітності; вихід керуватиме діями через маркетингові та продуктові команди.
Етап 1: Уточнення цілей дослідження та питань рішень
Визначте вашу ціль чітко та виведіть п'ять питань рішень, які керуватимуть діями перед роботою з даними. Зберіть погляди зацікавлених сторін, щоб забезпечити узгодженість та уникнути втрати часу на нечіткі цілі. Використовуйте фреймворк мур для формулювання проблеми: вкажіть вид рішень, дій, які послідують, та метрик, які судитимуть успіх. Включіть явні припущення та спроектуйте тестувані гіпотези, щоб ви могли інтерпретувати результати. Цього достатньо, щоб виправдати дії.
Кожне питання відповідає відповіді, яка інформує конкретні кроки та вимірюваний успіх. Перетворіть питання на індикатори, для яких ви можете зібрати дані, щоб дослідження доставляло практичні інсайти сьогодні. Вони також відображають погляди з різних функцій, та інсайти повинні надходити з довгострокових перспектив, що охоплюють кілька кварталів. Уточніть контекст рішення: визначте дії конкурентів, які могли б змінити результати, та вкажіть, що ви зберете, щоб відповісти на питання, включаючи дані про поведінку клієнтів та ринкові сигнали. Оберіть методології дослідження, які пасують питанням, та тримайте плани достатньо простими, щоб прискорити прогрес; правила інтерпретації та чіткий фреймворк судження допомагають перекладати знахідки в рекомендовані дії.
Документуйте припущення, визначте ролі та встановіть реалістичний таймлайн. Якщо з'являється нова інформація, ви можете або скоригувати план, або вдосконалити питання, а не починати заново. Використовуйте цей фокус вперед, щоб тримати імпульс та доставити стислий, готовий для зацікавлених сторін бриф з сильною, практичною рекомендацією.
Етап 2: Визначення зацікавлених сторін та потреб в інформації
Створіть мапу зацікавлених сторін та потреб в інформації в простій формі протягом 60 хвилин, потім валідуйте її з основними командами.
Перелічіть, хто бере участь у маркетинговій програмі та хто використовуватиме результати. Залучіть внутрішні команди – маркетинг, продукт, продажі, фінанси – та зовнішні групи – клієнтів, партнерів, постачальників та репрезентативну підмножину жінок з ключових демографічних сегментів. Використовуйте швидкі інтерв'ю та короткі опитування, щоб зафіксувати пріоритети, обмеження кожної групи та що вони очікують дізнатися.
Визначте інформацію, яку ви потребуєте на зацікавлену сторону. Розгляньте фактори, такі як рівень рішення, часовий горизонт та формат доставки. Спроектуйте форму чи шаблон, який записує зацікавлену сторону, роль, потреби в даних, бажаний формат, час доставки та як знахідки будуть використані. Форма надає точне керівництво та спроектована, щоб мінімізувати незавершені елементи.
Використовуйте вторинні джерела для надання контексту: існуючі звіти, соціальні канали та демографічні дослідження. Матриця мапує зацікавлених сторін до потреб в інформації, показує джерела даних, шкали для рейтингу важливості та формат доставки для кожного елемента. Це допомагає команді узгодити, що аналізувати та що ділити з ким.
Сесії сторітелінгу та швидкі воркшопи дають голоси різноманітним групам та інформують дослідницьку програму практичним внеском. Процес дає чіткий, практичний план, через який команда може перейти в наступних кроках, забезпечуючи, що дослідження залишається фокусованим на реальних потребах та очікуваннях.
Поділіться мапою з зацікавленими сторонами для затвердження та перетворіть її в план дослідження. Це забезпечує, що всі працюють з єдиним, поінформованим поглядом.
Етап 3: Встановлення обсягу, таймлайну та бюджету
Вибраний обсяг визначає роботу: оберіть 3–5 основних питань, які охоплюють основні сегменти клієнтів та бізнес-цілі, які ви хочете вплинути. Використовуйте ці питання, щоб вирішити, які дані ви зберете, хто буде залучений та які результати ви виробите. Створіть односторінковий бриф обсягу та отримайте затвердження від основних зацікавлених сторін, щоб уникнути розширення обсягу.
Створіть план для цих способів збору даних: співбесіди віч-на-віч, фокус-групи та стислі онлайн-опитування. Адаптовані до ваших профілів клієнтів, цей мікс охоплює основні питання та розкриє патерни через групи. Початковий дизайн включає текстові нотатки та закодовані відповіді для аналізів, щоб результати можна було порівняти швидко.
Ці кроки впливають на те, скільки часу вам потрібно та який бюджет призначити, особливо для маркетологів, яким потрібні чіткі сигнали для дій. Ця установка залучає зацікавлених сторін, щоб підтримувати узгодженість та дозволяє маркетологам швидко реагувати на знахідки. Якщо ви проводите роботу самостійно, робіть це в чітких фазах: початкова установка на тиждень 1; збір даних на тижні 2–3; аналізи на тижні 4–5; фінальний звіт на тиждень 6. Хоча у вас немає повної команди, ви можете виконувати критичні завдання самостійно та тримати єдиний текстовий документ для відстеження рішень та змін. Якщо щось змінюється, оновіть план та повідомте зміни всім зацікавленим сторонам. Аналізи проводяться з перевірками від другого рецензента.
Бюджет та непередбачені: оцініть загальний через методи та інструменти. Для середнього дослідження цільте 28 000–32 000 USD. Розподіліть приблизно: опитування 9 000, віч-на-віч 7 000, фокус-групи 4 000, аналізи та звітність 6 000, інструменти чи стимули 2 000 та 2 000 на непередбачені. Цей розподіл допомагає планувати витрати та покривати затримки без сюрпризів.
| Елемент | План | Таймлайн | Бюджет (приблизно) |
|---|---|---|---|
| Обсяг | Оберіть 3–5 основних питань; визначте групи клієнтів; затвердження | 1–2 дні | 0–2k |
| Збір даних | Співбесіди віч-на-віч, фокус-групи, онлайн-опитування; текстові нотатки для аналізів | 2–3 тижні | ~12k |
| Аналізи & звіт | Кодування відповідей; проведення аналізів; синтез інсайтів у рекомендації | 2 тижні | ~8k |
| Непередбачені & інструменти | Стимули, програмне забезпечення, логістика | Безперервно | ~4k |
Етап 4: Вибір дизайну дослідження та методології
Почніть з конкретної рекомендації: узгодьте дизайн з вашими цілями та даними, які ви потребуєте. Якщо ви хочете описати поточні патерни, оберіть описові чи перерізні підходи; для інсайтів причина-наслідок плануйте експерименти чи квазі-експерименти. У плануванні мапуйте кожну ціль до елемента даних та методу, щоб уникнути збору неправильного. Використовуйте спостереження, щоб зафіксувати поведінку та поєднуйте їх з сфокусованими питаннями, щоб зібрати як числа, так і контекст. Якщо ціна важлива, деталізуйте, як дані про ціну будуть зібрані та проаналізовані, щоб розкрити еластичності та проблеми, пов'язані з ціною, з якими стикаються клієнти. Ваша команда призначає ролі та встановлює чіткий шлях, щоб результати були готові для дій. Якщо ви хочете швидших рішень, побудуйте легкий пілот зараз та масштабуйте пізніше.
Оберіть категорію дизайну: дослідницьку, описову чи причинну. Уточніть джерела даних та структуру даних: кількісні опитування, якісні інтерв'ю чи змішані методи. Визначте вікна збору даних: єдиний знімок чи серія з часом; якщо потрібен моніторинг з часом, плануйте лонгітюдний підхід. Вирішіть, де ви досягнете респондентів: онлайн-платформи, магазини, польові візити чи мобільні додатки. Збір даних буде проведено через онлайн-платформи спочатку, з польовими візитами як резерв, якщо потрібно. Перед тим, як зобов'язатися, протестуйте здійсненність з малим пілотом, щоб зловити будь-які практичні проблеми.
Оберіть мікс методології: самостійний метод чи комбінацію. Типова установка може включати онлайн-опитування для масштабування питань, плюс кілька спостережень для валідації само-звітів. Використовуйте питання, які цілять цілі та уникають упередженості: включайте нейтральне формулювання та збалансовані варіанти відповідей. Для певних гіпотез експерименти чи A/B-тести можуть виміряти вплив проти контрольної умови. Використовуйте моніторинг, щоб відстежувати якість відповідей та відмови, та плануйте рутину очищення даних, щоб тримати результати точними. Забезпечте, щоб інструменти приваблювали респондентів, щоб підтримувати залучення.
Перетворіть ваш план у конкретне виконання: призначте таймлайн, визначте критерії успіху та вкажіть інструменти на платформах, які ви використовуватимете. Забезпечте, щоб дизайн був правильним для вашого контексту, перевіряючи обмеження: бюджет, час, потужність команди та управління даними. Підтвердіть узгодженість з цілями та встановіть точки моніторингу, щоб сигналізувати проблеми рано. Створіть стислий, практичний посібник для команди, щоб слідувати, так щоб польова робота проходила гладко, де розташовані респондентні. Цей підхід допомагає досягти практичних інсайтів та тримає проект на шляху. Якщо вам колись потрібно повернути, проведіть швидке слідуюче дослідження з lean-дизайном, щоб вдосконалити розуміння.
Фаза 2: Планування, збір та аналіз даних

Визначте рішення, яке ви хочете, щоб дані інформували, та почніть створювати мінімальний життєздатний набір даних перед тим, як залучати респондентів. Це створює надійну базу та допомагає запобігти падінню якості, коли ви масштабуєте дослідження. Ось чому узгодження даних з рішеннями прискорює дію та зменшує відходи.
Визначте ідентифіковані джерела даних, включаючи опитування, дані використання та якісні нотатки, та перелічіть типи даних, які ви зберете. Мапуйте кожен тип до дії рішення, щоб команда могла просуватися без неоднозначності. Ця фаза дає вам змогу планувати вибірку, згоду та стислий набір питань, який узгоджується з патернами використання користувачів та бізнес-цілями.
Оберіть стек програмного забезпечення, який підтримує планування, збір та аналіз. Програма на кшталт quantilope спрощує робочий процес, дозволяючи швидке дослідження та прогнози. Вона повинна консолідувати дані з контактів через канали та доставляти чіткі виходи для зацікавлених сторін.
-
Планування вимог до даних
- Визначте рішення, які ви інформуватимете (наприклад, пріоритет функцій, ціноутворення, повідомлення) та метрики, які доведуть вплив.
- Перелічіть типи даних: кількісні (шкали, рейтинги), якісні (відкриті відповіді), індикатори використання та демографічні риси.
- Визначте джерела: опитування, інтерв'ю, логи використання, експорти CRM та соціальне прослуховування; включайте ідентифіковані джерела та забезпечте ті самі інтерфейси даних.
- Встановіть цілі: розміри вибірки (наприклад, 300 завершених опитувань, 15–20 інтерв'ю), квоти за сегментом та план моніторингу ставки відповідей, щоб запобігти падінню якості.
- Визначте управління: згода, утримання та правила обробки даних.
-
Збір даних
- Залучайте з контактів та каналів; відстежуйте ставку відповідей та коригуйте канали, якщо не досягали цілей.
- Спроектуйте стислу анкету та посібник інтерв'ю, які охоплюють ідентифіковані теми без дублювання зусиль; тримайте послідовну структуру, щоб полегшити порівняння знахідок.
- Використовуйте множинні джерела, щоб збагачувати дані використання та соціальні сигнали, включаючи експорти CRM та веб-аналітику, щоб забезпечити надійний набір даних, який може вирішувати різні сценарії.
- Логуйте кожну дію: кого контактували, коли та що зібрали; це походження дозволяє вам виміряти використання кожного потоку даних та його внесок у прогнози.
-
Очищення та валідація даних
- Видаляйте дублікати, стандартизуйте формати та позначайте неповні відповіді; ті, що не відповідають критеріям, повинні бути виключені з аналізу.
- Гармонізуйте ідентифікатори, щоб злиття через джерела залишалися надійними; зберігайте єдине джерело істини для кожного респондента.
- Документуйте будь-які обмеження даних та припущення, щоб команда могла інтерпретувати знахідки з правильним контекстом.
-
Аналіз даних
- Проводьте описову статистику, крос-таби та сегментацію, щоб знайти патерни; використовуйте візуали, щоб виділити, де використання керує уподобаннями та де демографія прогнозує поведінку.
- Прогнозуйте прогнози для ключових дій, таких як поглинання функцій чи чутливість до ціни, та тестуйте сценарії, щоб кількісно оцінити потенційні результати.
- Валідайте результати проти цілей плану, забезпечуючи, що ті самі висновки трималися б, якщо перезапустити дослідження з подібною вибіркою.
- Експортуйте виходи в дашборди чи звіти, які легко ділити з зацікавленими сторонами, полегшуючи не-технічним командам діяти.
-
Результати та наступні кроки
- Підсумовуйте знахідки в стислому брифі: сегменти користувачів, основні інсайти та рекомендовані дії, підтримані надійними метриками.
- Виділіть, з чим просуватися в Фазі 3, включаючи конкретні експерименти, пілоти чи швидкі тести, щоб валікувати навчання в ринкових умовах.
- Надайте план швидкого старту для команди: призначте власників, визначте таймлайни та вкажіть заходи успіху для наступної фази.
З завершенням Фази 2 у вас буде чіткий шлях перекладати інсайти в дії, використовуючи програмне забезпечення та процеси, які дають командам змогу досліджувати дані, знаходити сигнали та вирішувати прагматично.
Етап 5: Розробка плану вибірки та джерел даних
Визначте чітку рамку вибірки та цільову популяцію перед вибором джерел даних. Використовуйте п'ятикроковий фреймворк, щоб побудувати надійний план, який підтримує надійні інсайти сьогодні та в майбутніх дослідженнях.
Крок 1: Уточніть популяцію та підгрупи, вкажіть рівень гранулярності (національний, регіональний чи сегмент), та визначте фактори, такі як демографія, поведінка та контекст рішення, які формуватимуть вибірку. Це забезпечує фіксацію типової варіації через групи та уникає пере- чи недо-представлення будь-якого місця чи когорти. Оскільки ви порівнюватимете такі групи, розгляньте квоти чи стратифіковану вибірку, щоб покращити репрезентативність та зменшити упередженість.
Крок 2: Оберіть метод вибірки з фокусом на статистичну валідність. Вирішіть між ймовірнісними методами (простий випадковий, стратифікований, кластерний) та неймовірнісними підходами, коли потрібні швидкі результати. Для онлайн-досліджень плануйте відстежувати кліки та патерни завершення, щоб оцінити якість респондентів, та узгодьте вибір методу з цілями вашого дослідження та очікуваннями менеджменту.
Крок 3: Оцініть розмір вибірки, використовуючи типову формулу n = (Z^2 · p(1−p)) / E^2, та закріпіть її до бажаного рівня упевненості та маржі помилки. Для більшості онлайн-досліджень 385 відповідей надають 95% упевненості при 5% MOE для великої популяції; розподіліть 100–200 відповідей на ключову підпопуляцію, щоб тримати результати стабільними. Якщо ви очікуєте множинні рівні чи рідкісні сегменти, збільште загальний, щоб підтримувати точність, але балансуйте з обмеженнями вартості та часу сьогодні.
Крок 4: Мапуйте джерела даних через первинні та вторинні опції та опишіть, як кожне джерело підтримує ваші цілі. Використовуйте якісні методи (інтерв'ю, фокус-групи, щоденникові дослідження), щоб досліджувати мотивації та драйвери, та кількісні підходи (опитування, спостереження, кон'юнктурний аналіз), щоб кількісно оцінити ефекти. Використовуйте безкоштовні публічні набори даних, коли релевантно, та збагачуйте внутрішні дані з систем менеджменту та CRM, щоб додати контекст. Для кон'юнктурних чи інших досліджень, фокусованих на атрибутах, забезпечте чітке визначення атрибутів та рівнів, щоб результат відображав реальні вибори, не здогадки.
Крок 5: Плануйте збір, огляд та управління, щоб тримати дані точними та придатними. Помістіть усі дані в одне місце з чітким контролем версій та впровадьте суворі перевірки якості: видаляйте дублікати, верифікуйте часткові завершення та позначайте неузгоджені відповіді. Процедури огляду повинні охоплювати етичні міркування та згоду, особливо для якісних сесій. Цей підхід покращує якість даних, підтримує інтеграцію через джерела та забезпечує, що дослідження залишається прозорим для інших, хто покладається на результати, включаючи менеджмент та зацікавлених сторін. Проектуючи контроли зараз, ви створюєте надійну основу, яка допомагає покращувати прогнозування та прийняття рішень з часом.
Етап 6: Дизайн практичних інструментів збору даних
Запустіть 2-тижневий пілот з 20-30 респондентами, щоб протестувати чіткість, час та потік відповідей, та перегляньте елементи відповідно, щоб доставити надійні числа.
Дотримуйтесь систематичного, узгодженого з методологією процесу, щоб побудувати інструменти, які пропонують дані високої якості через додатки та канали, поважаючи брендинг та обмеження приватності. Хоча це додає кроки, воно дає довговічні інсайти, на яких ми можемо діяти.
-
Визначення цілей та узгодження: визначте змінні, які ви моделюватимете для прогнозів, мапуйте кожен елемент до конструкту та забезпечте, щоб ваш інструмент слідував обраній методології та брендинговим рекомендаціям. Включіть чіткі посилання на те, як результати вплинуть на рішення та підтримають результати, пов'язані з брендингом.
-
Дизайн типів інструментів: опитування для широти, посібники інтерв'ю для глибини, чек-листи спостереження для поведінки та щоденники для щоденних точок дотику. Для кожного типу вкажіть, коли воно пропонує найкращий інсайт, як ви слідуєте за знахідками та якій аудиторії воно пасує. Цей етап також обговорює план запуску та способи ефективного досягнення респондентів. Це запропонує практичні опції для різних дослідницьких питань.
-
Дизайн елементів та форматів відповідей: складіть точні твердження; уникайте подвійних елементів; оберіть п'яти- чи семибальні шкали з нейтральною серединою; тримайте елементи чіткими та просто сформульованими; використовуйте числа в мітках шкал, щоб покращити порівнянність; забезпечте логічний потік та логіку пропусків. Цей підхід підтримує якість даних та робить аналіз прямолінійнішим.
-
План вибірки та числа: визначте рамку вибірки, цільовий розмір вибірки (наприклад, N=300-400 для споживчого опитування), очікувану ставку відповідей 15-25% та план для перевибірки, якщо потрібен аналіз підгруп. Створіть список аудиторій та квот, щоб відображати брендинг та сегментацію ринку, та включіть бенчмарки конкуренції як точки відліку, хоча ви можете адаптувати цілі за каналом чи регіоном.
-
Попереднє тестування та валідація: проведіть когнітивні інтерв'ю з 5-8 респондентами, щоб оцінити чіткість елементів та упередженість, потім проведіть малий польовий тест, щоб виміряти час та якість даних. Вдоскональте формулювання, порядок та опції відповідей на основі знахідок та документуйте зміни для відстеження. Хоча кроки можуть здаватися гранульованими, вони запобігають великим проблемам пізніше.
-
Захоплення даних, бази даних та контроли якості: спроектуйте форми введення даних з правилами валідації, логікою гілок та обов'язковими полями; зберігайте відповіді в базах даних з словником даних та схемою кодування; впровадьте перевірки, щоб запобігти невалідним значенням; проводьте пульс-перевірки на потік даних, щоб зловити проблеми рано; забезпечте приватність та етичну обробку інформації респондентів.
-
Документація та план запуску: створіть детальний кодбук, що перелічує імена змінних, типи та коди; включіть покроковий чек-лист запуску, відповідальності та таймлайн; відстежуйте проблеми та ітерації, та плануйте періодичні огляди, щоб підтримувати якість під час запуску. Хоча процес структурований, залишайтесь гнучкими, щоб вирішувати технічні проблеми, коли вони виникають.
Ready to leverage AI for your business?
Book a free strategy call — no strings attached.


