Звіт Google PageSpeed Insights — Детальний посібник


Запустіть звіт PageSpeed Insights сьогодні та виправте три основні проблеми, які найбільш уповільнюють вашу сторінку. Результат відображає часову середню ключових сигналів продуктивності. Використовуйте підказку зі звіту, щоб націлитися на дієві вузькі місця та досягти вимірюваних покращень.
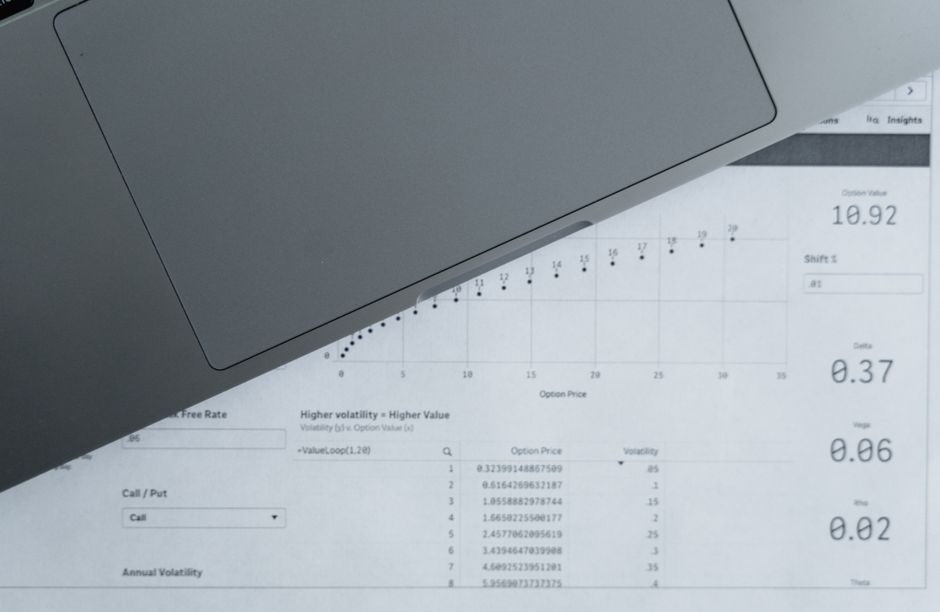
У перевірках у фоновому режимі виявляйте надмірні ресурси та проблеми з блокуванням рендерингу. Аналіз показує, де ховаються витоки часу; діаграми ілюструють зсув часу на різних пристроях і допомагають вам пріоритизувати, що виправити першим. У деяких випадках основна проблема — це CSS, що блокує рендеринг. Цей погляд уточнює значення кожної зміни та розкриває, що варто переслідувати.
Оберіть конкретні оптимізації та протестуйте їх: підвищуйте ефективність зображень, переходячи на формати наступного покоління (WebP/AVIF), увімкніть стиснення gzip або Brotli та вбудовуйте критичні елементи, щоб зменшити блокування рендерингу. Відкладіть некритичні скрипти та обмежте кількість запитів медіа; ці кроки можуть скоротити час завантаження на 20–40% на типових сторінках і зменшити надмірну роботу CPU на мобільних пристроях. Вирішуйте проблеми скриптів третіх сторін, щоб мінімізувати уповільнення та зберігати сторінку чутливою, оскільки пристрої варіюються. Це дає більш послідовні результати та показує більше покращень на мобільних.
Стратегія тестування: проводьте повторні тести в різний час і на реальних пристроях. Вимірюйте LCP менше 2.5 с, FID менше 100 мс, CLS нижче 0.1 як цілі. Використовуйте діаграми для порівняння до/після; зосередьтеся на виправленнях, які дають найбільші значущі покращення. Оберіть проведення тестів як на десктопі, так і на мобільних налаштуваннях, щоб виявити проблеми, специфічні для пристроїв, та забезпечити, щоб навігація з клавіатури залишалася швидкою під час перезавантажень.
Підтримуйте тісний час до взаємодії, скорочуючи фонові завдання та уникаючи надмірної роботи над некритичними елементами. Якщо ви бачите запити медіа або великі активи у фоновому режимі, відкладіть їх до моменту, коли основний контент відрендериться. Результат — швидший досвід, який аудиторія може відчути, роблячи зусилля вартими для репутації вашого сайту та залучення.
Практичні кроки для перетворення даних PageSpeed Insights на швидші сторінки
Аудитуйте блокери PSI та виправте критичний шлях зараз, особливо ресурси, що блокують рендеринг, які затримують First Contentful Paint. Встановіть цілі: LCP <= 2.5 с, CLS <= 0.1 та TBT <= 300 мс, щоб створити чіткий бенчмарк для кожної зміни. Відстежуйте базову лінію в простій діаграмі, щоб ви могли бачити прогрес протягом днів і порівняння до/після там.
Вбудовуйте найбільш критичний CSS та відкладайте некритичний CSS, щоб зменшити початкове навантаження; це часто скорочує час до першого рендерингу на 20–40% на практиці. Вимірюйте вплив, зіставляючи зміни з LCP та CLS, і використовуйте легкий посібник, який пояснює, які правила вплинули на результат і чому. Якщо правило спричиняє регресію, поверніть його та переоцініть в тому ж контексті, щоб зберегти зміни зосередженими на шляху користувача.
Скоротіть, відкладіть або асинхронно завантажуйте JavaScript; не завантажуйте скрипти третіх сторін, які не сприяють основному досвіду, і завантажуйте решту після появи основного контенту. Для скриптів третіх сторін, які ви мусите зберегти, відкладіть їх виконання до моменту, коли сторінка візуально готова, і розгляньте завантаження їх тільки на взаємодію користувача там. Цей підхід зменшує тривалість довгих завдань і допомагає правильним активам з'являтися швидше.
Оптимізуйте зображення за допомогою стиснення, конвертації в WebP або AVIF та увімкнення лінивого завантаження, щоб активи з'являлися під час прокрутки користувачем. Цільтеся зменшити байти зображень на значну маржу (часто 20–60% залежно від сайту), зберігаючи перцептивну якість, і перевірте, що найбільше зображення на екрані використовує найменший прийнятний формат для контексту.
Подавайте адаптивні зображення через srcset та sizes, і застосовуйте просте правило для перемикання форматів на основі розміру вікна та умов мережі, щоб зображення високої якості не коштувало зайвих байтів. Це зберігає візуальну історію недоторканою, водночас зменшуючи навантаження на мобільних пристроях, що є частим драйвером покращень LCP там.
Запровадьте стратегію кешування та мінімізуйте навантаження: використовуйте CDN, тримайте динамічні навантаження легкими та застосовуйте довгі терміни кешу для незмінних активів, оновлюючи при розгортанні. Легка політика кешу часто дає швидші повторні завантаження та допомагає діаграмі тенденцій продуктивності залишатися сприятливою протягом днів і сесій користувача.
Створіть базову лінію та повторно запускайте PSI після кожного набору змін; порівнюйте рейтинг на діаграмі та відстежуйте дні між ітераціями, щоб підтвердити реальні покращення, після чого ви можете планувати наступний набір удосконалень. Використовуйте цей ритм, щоб зберегти імпульс без перевантаження команди занадто багатьма одночасними змінами.
Контекст має значення: документуйте, що змінилося, чому це важливо та як це пов'язано з перцепцією користувача; це допомагає колегам діяти на даних під час проектування подальших удосконалень і зберігає фокус на тому, що насправді рухає стрілку в продакшені там.
Розсилки для стейкхолдерів: включайте конкретні метрики, хронологію та наступні зміни, щоб прогрес був прозорим. Підготуйте стислий підсумок з числами до/після для LCP, CLS та TBT, плюс нотатку про будь-які коригування скриптів третіх сторін та результати оптимізації зображень.
Цей посібник надає готовий чекліст для команд для застосування; чи працюєте ви над лендінговими сторінками чи дашбордами, перетворюйте дані PSI на швидші сторінки, які користувачі відчувають. Визначте cadence (наприклад, щотижневі повторні перевірки та глибший огляд кожні 14 днів) і дотримуйтеся його, щоб покращення залишалися вимірюваними та дієвими.
Інтерпретація можливостей PSI: виявлення високовпливних виправлень, що зменшують час завантаження

Застосовуйте цільові виправлення, що зрізають сотні мілісекунд з початкового завантаження сторінки, пріоритизуючи ресурси, що блокують рендеринг, оптимізацію зображень та вплив третіх сторін. Цей підхід негайно покращує сприйняту чутливість для адаптивних макетів та дотиків, водночас зменшуючи загальну кількість запитів, які мандрівники бачать по всьому сайту.
Спроектуйте робочий процес, що відображає сигнали PSI та реальну поведінку користувача (користувача). План повинен залишатися тісним до основних блокерів на сторінці та масштабуватися по сайту, з конкретними діями, вимірюваними цілями та чіткою картою власності. Створіть стислий чекліст, що узгоджується з вашим стеком та cadence тестування.
-
Ресурси, що блокують рендеринг, та робота основного потоку
- Вбудовуйте критичний CSS та відкладайте некритичний CSS, щоб зменшити роботу основного потоку під час завантаження; забезпечте, щоб DOMContentLoaded був раннім і стабільним, починайте з чистого макету; цільтеся скинути довгі завдання, що штовхають блокуючий час у сотні мілісекунд.
- Відкладайте або асинхронно завантажуйте JavaScript, що не залежить; розбивайте код за маршрутами чи функціями, видаляючи невикористаний код та зменшуючи розмір стеку на початковий пейнт; моніторьте роботу та запити, щоб тримати загальну роботу в тісному бюджеті.
- Усувайте невикористаний CSS у основному стеку та обрізайте важкі залежності, що надувають тривалість завдань; відображаєте зміни в PSI як покращений CLS та швидшу відповідь на першу взаємодію.
-
Оптимізація зображень та медіа
- Подавайте формати наступного покоління (WebP, AVIF) там, де підтримується; змінюйте розмір до точних розмірів дисплея та надавайте адаптивні зображення через srcset та sizes; ліниво завантажуйте активи поза екраном, щоб уникнути сплесків завантаження на початковий пейнт.
- Стискайте активи з розумною якістю, увімкніть правильне кешування та видаліть завеликі зображення, що викликають зсуви макету; це допомагає користувачам мандрувати сторінкою без заїкань.
- Тримайте бюджет зображень на сторінку та перевірте, що зображення сприяють плавному, чутливому рендерингу від основного контенту вниз до менших вікон.
-
Скрипти третіх сторін та зовнішні запити
- Аудитуйте запити третіх сторін та видаляйте або відкладайте некритичні; завантажуйте суттєві скрипти після взаємодії користувача або на пізнішій фазі, мінімізуючи вплив на початкову відповідь та роботу основного потоку.
- Об'єднуйте або ліниво завантажуйте аналітику, віджети та рекламу; відстежуйте сигнали, що відображають сприйняту затримку користувачем та реальну поведінку завантаження; кожен додатковий запит повинен виправдовувати свою користь для продуктивності.
- Хостуйте критичний контент третіх сторін ближче до користувачів через надійний CDN та застосовуйте суворі бюджети таймаутів, щоб запобігти каскадним затримкам.
-
Відповідь сервера та кешування
- Покращуйте час відповіді сервера (TTFB), увімкнувши стиснення (Brotli переважно), fallback gzip та edge-кешування, де можливо; налаштовуйте запити бази даних та серверний рендеринг, щоб зменшити ранню роботу.
- Запровадьте довготривале кешування для статичних активів з хешованими іменами файлів; використовуйте CDN, щоб зрізати час круглого шляху та стабілізувати доставку для глобальних користувачів сайту.
- Переглядайте накладні витрати на кукі та заголовки; мінімізуйте непотрібні перенаправлення та оптимізуйте пошуки DNS, щоб тримати загальний час запиту під контролем.
-
Моніторинг, симуляція та валідація
- Запускайте симуляції PSI та Lighthouse на репрезентативних лабораторних пристроях, щоб оцінити вплив на сторінку, сайт та загальну подорож користувача; відстежуйте зміни в мілісекундах для ключових метрик (LCP, TTI, CLS та загальних запитів).
- Налаштуйте моніторинг реальних користувачів, щоб захопити сигнали по пристроях та мережах; моніторьте дельту до/після, щоб підтвердити покращення для користувацьких сценаріїв.
- Використовуйте спеціальну панель для спостереження за роботою основного потоку, довгими завданнями та доступним часом відповіді; запускайте сповіщення, якщо CLS або TBT регресує за межі порогів, поки завантаження стає менш чутливим на пристроях з дотиком.
Реалізація починається з чіткого, пріоритизованого плану, що пов'язує можливості PSI з конкретними змінами коду, кроками тестування та критеріями відкату. Кожне виправлення повинно демонструвати вимірюване падіння часу завантаження та плавнішу взаємодію на всіх пристроях, з увагою до балансу між готовим станом та сприйнятою продуктивністю на пристрої користувача. Добре структурована симуляція та постійний моніторинг відображають прогрес і керують наступною частиною оптимізації для сайту.
Декодування діагностики: розуміння прапорців, що впливають на продуктивність реальних користувачів
Увімкніть стиснення Brotli для html та інших текстових форматів; це може драматично скоротити навантаження через швидші передачі, покращуючи швидкості реальних користувачів. Brotli стискає навантаження html ефективніше, ніж gzip, і швидке налаштування сервера часто дає видимі покращення в першому пейнті та часі до інтерактиву.
Декодуйте діагностику, зосереджуючись на прапорцях, що уповільнюють реальних користувачів: ресурси, що блокують рендеринг, довгі завдання та завеликі пакети JavaScript. Далі йдуть конкретні кроки для дій на цих сигналах. Вимірювання впливу на реальних користувачів означає пов'язування даних діагностики з вхідними даними від відвідувачів та історією продуктивності; спостерігайте, як прапорці корелюють з довшими чи коротшими часами завантаження по різноманітних мережах, включаючи реальні сценарії користувачів.
Використовуйте розподіл перцентиля (перцентиль) метрик, як Largest Contentful Paint (LCP) та Time to Interactive (TTI), щоб оцінити вплив по світу. Глобальні дані від відвідувачів допомагають вам бачити, як зміни працюють у масштабі, тоді як історія показує, чи рухають налаштування стрілку з часом. Відстежуйте 95-й перцентиль, щоб виявити найдовші досвіди та керувати виправленнями для URL-адрес та активів.
Практичні кроки, які ви можете застосувати зараз: вбудовуйте критичний html та CSS, щоб зменшити круглі шляхи, відкладайте некритичні скрипти та покладайтеся на сучасні текстові формати зі стисненням. Це також включає подачу активів у сучасних форматах та увімкнення preconnect та prefetch, де доречно. Тестуйте по різних формфакторах і переходьте від базових перевірок до найкращих практик, тримаючи око на прапорцях, що сигналізують непотрібний код чи завеликі пакети.
Дані, історія тестів та вимірювання результатів повинні перевести вас у світ, де сторінки відчуваються чутливими для всіх відвідувачів, на будь-якій швидкості мережі. Використовуйте вхідні дані від реальних користувачів, щоб вирішити, які прапорці вирішувати першими, потім валідуйте вплив свіжими даними та чіткішими інсайтами.
Зменшення ресурсів, що блокують рендеринг: дієві кроки оптимізації CSS та JavaScript
Вбудовуйте мінімальний CSS вище лінії згину та завантажуйте решту асинхронно, щоб скоротити час блокування рендерингу. Цей підхід каже вам точно, які правила насправді впливають на перший пейнт і допомагає планувати оптимізації для досвіду перегляду. Це не про видалення всього CSS; ви мусите зберегти те, що призначене для початкового перегляду, уникаючи надмірного блокування.
поради: виявіть CSS, необхідний для початкового перегляду, та вбудуйте його. Тримайте вбудований блок легким (цільтеся нижче 15–20 КБ стиснених gzip). Для випадку з кількома маршрутами сформуйте мінімальний піднабір CSS та перевикористовуйте по подібних сторінках. Це каже вам, які правила насправді впливають на перший пейнт і допомагає при перегляді на мережевих локаціях з різною пропускною здатністю. Ситуація стає чіткішою, коли ви вимірюєте на різних браузерах і бачите, як завантаження змінюється по локаціях, що вказує, де обрізати.
Перемістіть некритичний CSS до окремого файлу та завантажуйте його після початкового рендерингу. Використовуйте патерн preload-and-switch: попередньо завантажуйте стилетаблицю, а потім змінюйте її rel на stylesheet при завантаженні. Це зменшує час блокування рендерингу, оптимізований для першого перегляду, і ви можете спостерігати зростання продуктивності по пристроях. Розширення оптимізації по сторінках є простим з code-splitting.
JS: Відкладайте або асинхронно скрипти, що не впливають на початковий пейнт. Позначте аналітику та віджети як async, і розмістіть основні скрипти безпосередньо перед закриваючим тегом body або завантажуйте їх з динамічними імпортами. Це тримає парсер вільним раніше та збільшує час до інтерактиву. Якщо не можете виміряти покращення негайно, запустіть легкий тест, щоб підтвердити вплив.
Шрифти та активи: попередньо завантажуйте критичні шрифти з font-display: swap, хостуйте їх як WOFF2 та конвертуйте важкі зображення UI в webp, щоб зменшити завантаження. Використовуйте preconnect до доменів CDN, щоб уникнути додаткових пошуки DNS, та налаштуйте підказки ресурсів для мережевих локацій. Якщо шрифт використовується тільки в пізнішому перегляді, завантажуйте його після початкового пейнту, щоб запобігти більшому блокуванню. У робочих процесах попередньо завантажуйте критичні активи, щоб тримати шлях рендерингу плавним та оптимізованим по браузерах.
Зображення та ліниве завантаження: запровадьте loading="lazy" для контенту поза екраном та атрибути sizes для адаптивних зображень. Використовуйте srcset та sizes, щоб мінімізувати навантаження, і забезпечте, щоб макети не зсувалися під час завантаження активів. Це зменшує марну мережеву активність і допомагає відчути покращення під час перегляду.
Кейс-стаді показують 20–40% швидший First Contentful Paint після видалення ресурсів, що блокують рендеринг, з подібними покращеннями в Time to Interactive по мережевих локаціях. Регулярні перевірки з Lighthouse або PageSpeed Insights вказують на покращення та розкривають решту можливостей. Коли ви підтвердили результати, ви можете продовжувати налаштовувати та масштабувати підхід, щоб відповідати еволюціонуючому трафіку та пристроям.
Обов'язкові включають обрізку невикористаного CSS та JS, оптимізацію форматів зображень та забезпечення, щоб завантаження шрифтів було неблокуючим. Використовуйте code-splitting за типом активу та підтримуйте живий чекліст. Був період, коли CSS надував сторінки; була епоха. Наступне — підтримувати та розширювати чекліст, щоб охопити нові фреймворки та умови мережі, тримаючи досвід швидким для перегляду по локаціях та браузерах.
Оптимізація зображень та сучасних форматів: стиснення, формати наступного покоління та ліниве завантаження
Почніть з точної конвертації геройських та зображень вище лінії згину в формати наступного покоління, такі як WebP та AVIF, та увімкніть ліниве завантаження на них. Використовуйте цілі перцептивної якості, щоб балансувати швидкість та вірність: якість WebP 75-85 для фото, AVIF 50-65, тримаючи логотипи та іконки в безвтратному WebP або PNG-8. Цей підхід часто дає 30-70% менші навантаження, ніж JPEG/PNG, прискорюючи перший контент та покращуючи досвід користувача.
Подавайте найкращий формат для кожного активу з стратегією, орієнтованою на джерело: надавайте WebP та AVIF поряд з JPEG/PNG в елементі picture, і дозвольте браузеру вибрати робочий варіант, з граціозним fallback для старіших двигунів. Цей глобальний підхід підходить без обмежень по середовищах з різними можливостями, і ви можете автоматизувати його інструментом, що виводить кілька форматів з єдиного джерела.
Попередньо завантажуйте найбільш критичне зображення (геройське або контент лінії згину) як ресурс зображення, щоб скоротити початковий пейнт, потім застосовуйте loading=lazy до всіх наступних зображень. Для некритичних візуалів попередньо завантажуйте тільки коли помічаєте значний вплив на сприйняту швидкість, і забезпечте, щоб ви не блокували рендеринг, затримуючи вторинні ресурси.
gzip (або Brotli) повинен бути увімкнений для HTML, CSS та JavaScript, щоб зменшити навантаження, тоді як зображення покладаються на власне стиснення на рівні формату та прогресивний рендеринг, якщо підтримується. Використовуйте прогресивні JPEG або інтерлейс PNG, де доречно, і тримайте загальну вагу зображень узгодженою з вашими цілями оптимізації.
У фазі аналізу вимірюйте, як зміни впливають на досвіди користувачів у мережах по пристроях. PageSpeed Insights та Lighthouse надають метрики швидкості, як LCP та CLS, і ви повинні помітити покращення в швидкостях, швидкостях та стабільності, коли зображення оптимізовані. Їхні кейс-стаді показують покращення, що виходять за межі лабораторних стін, особливо для користувачів, що переживають повільні з'єднання в глобальних регіонах у середовищах з різноманітними мережами.
Керуйте вашою командою практичним чеклістом, що включає фокус на автоматизації, тестуванні та обслуговуванні. Включіть список кроків: генеруйте кілька форматів з кожного джерела, налаштовуйте fallbacks, попередньо завантажуйте критичні зображення, увімкніть ліниве завантаження, активуйте gzip/Brotli на активах та проводьте регулярні цикли вимірювань за допомогою PSI, Lighthouse та даних реальних користувачів. У цьому випадку активи повинні бути оптимізовані за допомогою конкретних порогів та постійного моніторингу, щоб запобігти регресіям та забезпечити дружній до користувача досвід для кожного відвідувача.
Покращення продуктивності сервера: стратегії кешування, стиснення та конфігурація CDN
Увімкніть edge-кешування та CDN зараз, щоб скоротити затримку на найбільших сторінках, переміщуючи контент ближче до користувачів. Ця дія зменшує навантаження на origin та прискорює перший перегляд, особливо для відвідувачів навколо глобальних локацій. Ваші наступні кроки автоматизовані, вимірювані та тісно контрольовані, щоб уникнути введення затримок блокування рендерингу.
Запровадьте шарувату політику кешування, що охоплює origin та edge. Встановіть Cache-Control з довгим max-age для статичних активів, використовуйте незмінні відбитки для версіонованого контенту та запускайте автоматизовані очищення при оновленнях. Це переміщує трафік до edge-локацій та збільшує співвідношення cache-hit, яке ваш моніторинг повинен валідувати як падіння запитів origin та швидше видимого завантаження. Якщо контент змінюється часто, тримайте короткий TTL на динамічних сегментах і покладайтеся на CDN для ефективної ревалідації. Цей підхід застосовується до контенту та медіа-активів однаково, і він працює, чи подаєте ви HTML, CSS чи скрипти. Можна оптимізувати вашу стратегію, пов'язуючи ключі кешу з типами контенту, рядками запитів та регіонами користувача, щоб максимізувати видимість та послідовність.
Стиснення повинно бути увімкненим для активів на основі тексту та налаштованим з повагою до можливостей клієнта. Увімкніть Brotli як первинний енкодер і тримайте gzip як fallback, забезпечуючи Vary: Accept-Encoding присутній, щоб посередники кешували правильно. Поєднуйте стиснення з мініфікацією, де можливо, але ви можете досягти значних покращень без мініфікації в багатьох випадках; вимірюйте результуючу текстуру навантажень та час до першого рендерингу, щоб забезпечити, що ви не додаєте накладних витрат. Ця комбінація зменшує розміри навантажень, що безпосередньо підтримує швидший рендеринг та плавніші взаємодії користувача, особливо на повільніших мережах.
Налаштуйте CDN з edge-кешами, що охоплюють найбільші групи контенту, включаючи зображення, скрипти та віджети. Використовуйте origin-shield або подібний шлюз, щоб захищати origin від сплесків, і встановіть правила за типом контенту та форматом медіа, щоб тримати гарячі елементи на найшвидших вузлах. Попередньо нагрівайте ключові активи для сторінок з високим трафіком та на основних точках релізу локаціях, щоб запобігти холодним стартам. Регулярно переглядайте ключі кешу та патерни інвалідації, щоб оновлення поширювалися швидко без надмірних очищень, що допомагає підтримувати точну видимість для користувачів по локаціях та пристроях.
Вирішуйте ресурси, що блокують рендеринг, безпосередньо. Вбудовуйте критичний CSS для частини сторінок вище лінії згину та відкладайте некритичний CSS та JavaScript. Завантажуйте віджети асинхронно або з лінивим завантаженням, щоб запобігти затримкам першого значущого пейнту. Розбиття пакетів та відкладання некритичних скриптів зменшує час блокування та допомагає браузеру представляти контент швидше користувачам, незалежно від того, де вони переглядають сайт.
Оптимізуйте медіа та активи третіх сторін, щоб запобігти уповільненням. Стискайте та змінюйте розмір зображень з сучасними форматами (WebP, AVIF) та доставляйте адаптивні зображення, що адаптуються до розміру вікна глядача. Для віджетів та скриптів аналітики перейдіть на асинхронне завантаження та використовуйте консервативний cadence оновлень, щоб мінімізувати повторні запити під час сесії користувача. Ці кроки тримають основний потік вільним і зменшують ризик уповільненого рендерингу на повільніших мережах.
Відстежуйте виміряні метрики, щоб валідувати покращення та інформувати оновлення. Зосередьтеся на TTFB, Largest Contentful Paint (LCP) та загальному часі блокування, разом з співвідношеннями cache-hit та 95-м перцентилем затримки за регіоном. Регулярні перевірки, керовані PSI, допомагають вам підтвердити, чи перекладаються зміни в реальні покращення видимості по сторінках та по локаціях глядача. Ваш план дій повинен переглядатися щоквартально, оновлюючи правила, TTL та формати активів, оскільки патерни трафіку змінюються та з'являються нові віджети.
| Область | Рекомендація | Вплив | Примітки |
|---|---|---|---|
| Кешування | Edge-кешування для статичних активів; довгий TTL з відбитками імен файлів; автоматизовані очищення | Збільшує співвідношення cache-hit; зменшує навантаження на origin | валідно для статичних активів; коригуйте для динамічного контенту |
| Стиснення | Brotli первинне; gzip fallback; Vary: Accept-Encoding | Зменшує розмір навантаження; прискорює рендеринг | Розгляньте мініфікацію; ви можете робити це без мініфікації або поряд |
| Конфігурація CDN | Геолокаційний роутинг; origin shield; кешування на основі правил за типом контенту | Нижча затримка; послідовні часи відповіді на edge-локаціях | Попередньо нагрівайте критичні активи для пікових часів |
| Блокування рендерингу | Вбудовуйте критичний CSS; відкладайте некритичний JS; ліниво завантажуйте віджети | Зменшує затримки рендерингу; швидший перший перегляд | Тестуйте вплив на стабільність макету |
| Медіа | Оптимізація зображень; сучасні формати; адаптивна доставка | Менші навантаження; швидше візуальне завантаження | Балансуйте якість та розмір на сторінку |
| Вимірювання | Відстежуйте LCP, TTFB, загальний час блокування; моніторьте метрики кешу | Чіткі докази зсувів продуктивності; дієві інсайти | Оновлюйте пороги, оскільки сторінки еволюціонують |
Ready to leverage AI for your business?
Book a free strategy call — no strings attached.


